Quest Diagnostics 2007 Annual Report Download - page 100
Download and view the complete annual report
Please find page 100 of the 2007 Quest Diagnostics annual report below. You can navigate through the pages in the report by either clicking on the pages listed below, or by using the keyword search tool below to find specific information within the annual report.-
 1
1 -
2
-
3
-
4
-
5
-
6
-
7
-
8
-
9
-
10
-
11
-
12
-
13
-
14
-
15
-
16
-
17
-
18
-
19
-
20
-
21
-
22
-
23
-
24
-
25
-
26
-
27
-
28
-
29
-
30
-
31
-
32
-
33
-
34
-
35
-
36
-
37
-
38
-
39
-
40
-
41
-
42
-
43
-
44
-
45
-
46
-
47
-
48
-
49
-
50
-
51
-
52
-
53
-
54
-
55
-
56
-
57
-
58
-
59
-
60
-
61
-
62
-
63
-
64
-
65
-
66
-
67
-
68
-
69
-
70
-
71
-
72
-
73
-
74
-
75
-
76
-
77
-
78
-
79
-
80
-
81
-
82
-
83
-
84
-
85
-
86
-
87
-
88
-
89
-
 90
90 -
 91
91 -
 92
92 -
 93
93 -
 94
94 -
 95
95 -
 96
96 -
 97
97 -
 98
98 -
 99
99 -
 100
100 -
 101
101 -
 102
102 -
 103
103 -
 104
104 -
 105
105 -
 106
106 -
 107
107 -
 108
108 -
 109
109 -
 110
110 -
111
-
112
-
113
-
114
-
115
-
116
-
117
-
118
-
119
-
120
 |
 |

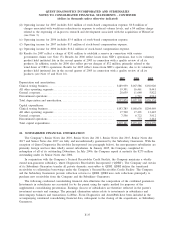
expected holding period of the options granted was estimated using the historical exercise behavior of employees.
The weighted average assumptions used in valuing options granted in the periods presented are:
2007 2006 2005
Weighted average fair value of options at grant date. . . ....... $18.05 $13.91 $14.17
Expected volatility .......................................... 21.5% 18.2% 23.0%
Dividend yield . . . ........................................... 0.7% 0.7% 0.7%
Risk-free interest rate ....................................... 4.7% - 4.8% 4.6% 3.9% - 4.0%
Expected holding period, in years. . . ......................... 5.3 - 6.2 5.6 - 6.2 5.4 - 5.9
The fair value of restricted stock awards and performance share units is the average market price of the
Company’s common stock at the date of grant.
Transactions under the stock option plans for 2007 were as follows:
Shares
(in thousands)
Weighted
Average
Exercise
Price
Weighted
Average
Remaining
Contractual
Term
(in years)
Aggregate
Intrinsic
Value
(in millions)
Options outstanding, beginning of year............ 13,249 $39.44
Options granted. . . ............................... 3,765 45.99
Options exercised . ............................... (2,450) 33.11
Options forfeited and cancelled ................... (626) 48.62
Options outstanding, end of year ................. 13,938 $41.91 5.2 $154
Exercisable, end of year . . . ...................... 8,740 $37.82 4.9 $132
Vested and expected to vest, end of year ......... 13,302 $41.44 5.2 $153
The aggregate intrinsic value in the table above represents the total pre-tax intrinsic value (the difference
between the Company’s closing common stock price on the last trading day of 2007 and the exercise price,
multiplied by the number of in-the-money options) that would have been received by the option holders had all
option holders exercised their options on December 31, 2007. This amount changes based on the fair market
value of the Company’s common stock. Total intrinsic value of options exercised in 2007, 2006 and 2005 was
$52 million, $106 million and $98 million, respectively.
As of December 31, 2007, there was $29 million of unrecognized stock-based compensation cost related to
stock options which is expected to be recognized over a weighted average period of 1.3 years.
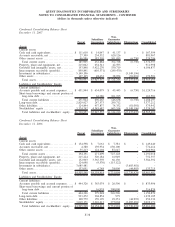
The following summarizes the activity relative to stock awards, including restricted stock awards and
performance share units, for 2007, 2006 and 2005:
Shares
(in thousands)
Weighted
Average
Grant Date
Fair Value
Shares
(in thousands)
Weighted
Average
Grant Date
Fair Value
Shares
(in thousands)
2007 2006 2005
Shares outstanding, beginning of
year ............................ 450 $52.41 107 $49.71 -
Shares granted ..................... 538 52.05 1,020 52.32 113
Shares vested ...................... (74) 52.30 (39) 50.26 (1)
Shares forfeited and canceled. ...... (100) 52.38 (56) 51.92 (5)
Adjustment to estimate of
performance share units to be
earned . . ........................ (137) 51.94 (582) 51.94 -
Shares outstanding, end of year..... 677 $52.24 450 $52.41 107
In the fourth quarter of 2007 and 2006, the Company revised its estimate of the number of performance
share units expected to be earned at the end of the performance periods as a result of revising its estimates of
F-30
QUEST DIAGNOSTICS INCORPORATED AND SUBSIDIARIES
NOTES TO CONSOLIDATED FINANCIAL STATEMENTS - CONTINUED
(dollars in thousands unless otherwise indicated)