Quest Diagnostics 2007 Annual Report Download - page 18
Download and view the complete annual report
Please find page 18 of the 2007 Quest Diagnostics annual report below. You can navigate through the pages in the report by either clicking on the pages listed below, or by using the keyword search tool below to find specific information within the annual report.-
 1
1 -
2
-
3
-
4
-
5
-
6
-
7
-
 8
8 -
 9
9 -
 10
10 -
 11
11 -
 12
12 -
 13
13 -
 14
14 -
 15
15 -
 16
16 -
 17
17 -
 18
18 -
 19
19 -
 20
20 -
 21
21 -
 22
22 -
 23
23 -
 24
24 -
 25
25 -
 26
26 -
 27
27 -
 28
28 -
29
-
30
-
31
-
32
-
33
-
34
-
35
-
36
-
37
-
38
-
39
-
40
-
41
-
42
-
43
-
44
-
45
-
46
-
47
-
48
-
49
-
50
-
51
-
52
-
53
-
54
-
55
-
56
-
57
-
58
-
59
-
60
-
61
-
62
-
63
-
64
-
65
-
66
-
67
-
68
-
69
-
70
-
71
-
72
-
73
-
74
-
75
-
76
-
77
-
78
-
79
-
80
-
81
-
82
-
83
-
84
-
85
-
86
-
87
-
88
-
89
-
90
-
91
-
92
-
93
-
94
-
95
-
96
-
97
-
98
-
99
-
100
-
101
-
102
-
103
-
104
-
105
-
106
-
107
-
108
-
109
-
110
-
111
-
112
-
113
-
114
-
115
-
116
-
117
-
118
-
119
-
120
 |
 |

Additionally, our customers are establishing positions outside the United States. Demographic changes globally
may also create opportunities.
Customers and Payers. We provide testing services to a broad range of customers, with orders for clinical
testing generally generated by physician offices, hospitals and employers. In most cases, the customer that orders
the testing is not responsible for the payments of services. We consider a party that refers a test to us a
“customer” and a party that reimburses us a “payer.” Depending on the billing arrangement and applicable law,
the payer may be (1) a third party responsible for providing health insurance coverage to patients, such as a
health insurance plan, self-insured employer benefit fund, or the traditional Medicare or Medicaid program,
(2) the patient or (3) the physician or other party (such as a hospital, another laboratory or an employer) who
referred the testing to us.
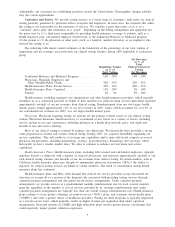
The following table shows current estimates of the breakdown of the percentage of our total volume of
requisitions and net revenues associated with our clinical testing business during 2007 applicable to each payer
group:
Requisition Volume
as % of
Total Volume
Net Revenues
as % of
Total
Clinical Laboratory
Testing
Net Revenues
Traditional Medicare and Medicaid Programs ............. 15% - 20% 15% - 20%
Physicians, Hospitals, Employers and
Other Monthly-Billed Clients........................... 30% - 35% 20% - 25%
Health Insurance Plans: Fee-for-Service . .................. 30% - 35% 40% - 45%
Health Insurance Plans: Capitated......................... 15% - 20% 5% - 10%
Patients ................................................. 2% - 5% 5% - 10%
Health insurers, including managed care organizations and other health insurance providers, which typically
reimburse us as a contracted provider on behalf of their members for clinical testing services performed, represent
approximately one-half of our net revenues from clinical testing. Reimbursement from our two largest health
insurer payers totaled approximately 11% of our net revenues in 2007. Aetna, which accounted for over 6% of
our consolidated net revenues for 2007, was our largest health insurer payer.
Physicians. Physicians requiring testing for patients are the primary referral source of our clinical testing
volume. Physicians determine which laboratory to recommend or use, based on a variety of factors, including
service; patient access and convenience, including inclusion in a health plan network; price; and depth and
breadth of test and service offering.
Most of our clinical testing is referred by primary care physicians. We historically have provided a strong
value proposition in routine and esoteric clinical testing. During 2007, we acquired AmeriPath, expanding our
service capabilities. This will enable us to leverage our capabilities and to more effectively compete in several
physician sub-specialties, including dermatology, urology, gastroenterology, hematology and oncology, where
historically we had a smaller market share. We plan to continue to enhance our test menu and service
capabilities.
Health Insurance Plans. Health insurance plans, including fully insured and self-funded employers, typically
negotiate directly or indirectly with a number of clinical laboratories, and represent approximately one-half of our
total clinical testing volumes and one-half of our net revenues from clinical testing. In certain markets, such as
California, health insurance plans may delegate to independent physician associations (“IPAs”) the ability to
negotiate for clinical testing services on behalf of certain members. The trend of consolidation among health
insurance plans has continued.
Health insurance plans and IPAs often demand that clinical test service providers accept discounted fee
structures or assume all or a portion of the financial risk associated with providing testing services through
capitated payment arrangements and discounted fee-for-service arrangements. Under capitated payment
arrangements, we provide services at a predetermined monthly reimbursement rate for each covered member,
generally regardless of the number or cost of services provided by us. Average reimbursement rates under
capitated payment arrangements are typically less than our overall average reimbursement rate. Health insurance
plans continue to focus product offerings on point-of-service (“POS”) plans, and consumer driven health plans
(“CDHPs”) that offer a greater choice of healthcare providers. Pricing for these programs is typically negotiated
on a fee-for-service basis, which generally results in higher revenue per requisition than under capitation
arrangements. Increased patients in CDHPs and high deductible plans involve greater patient cost-sharing; this
could negatively impact patient collection experience.
9