Quest Diagnostics 2007 Annual Report Download - page 111
Download and view the complete annual report
Please find page 111 of the 2007 Quest Diagnostics annual report below. You can navigate through the pages in the report by either clicking on the pages listed below, or by using the keyword search tool below to find specific information within the annual report.-
 1
1 -
2
-
3
-
4
-
5
-
6
-
7
-
8
-
9
-
10
-
11
-
12
-
13
-
14
-
15
-
16
-
17
-
18
-
19
-
20
-
21
-
22
-
23
-
24
-
25
-
26
-
27
-
28
-
29
-
30
-
31
-
32
-
33
-
34
-
35
-
36
-
37
-
38
-
39
-
40
-
41
-
42
-
43
-
44
-
45
-
46
-
47
-
48
-
49
-
50
-
51
-
52
-
53
-
54
-
55
-
56
-
57
-
58
-
59
-
60
-
61
-
62
-
63
-
64
-
65
-
66
-
67
-
68
-
69
-
70
-
71
-
72
-
73
-
74
-
75
-
76
-
77
-
78
-
79
-
80
-
81
-
82
-
83
-
84
-
85
-
86
-
87
-
88
-
89
-
90
-
91
-
92
-
93
-
94
-
95
-
96
-
97
-
98
-
99
-
100
-
 101
101 -
 102
102 -
 103
103 -
 104
104 -
 105
105 -
 106
106 -
 107
107 -
 108
108 -
 109
109 -
 110
110 -
 111
111 -
 112
112 -
 113
113 -
 114
114 -
 115
115 -
 116
116 -
 117
117 -
 118
118 -
 119
119 -
 120
120
 |
 |

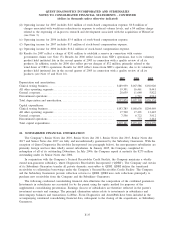
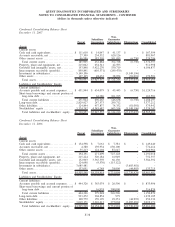
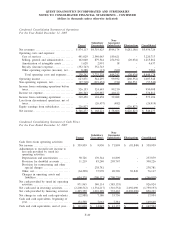
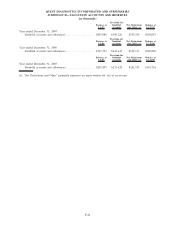
QUEST DIAGNOSTICS INCORPORATED AND SUBSIDIARIES
NOTES TO CONSOLIDATED FINANCIAL STATEMENTS - CONTINUED
(dollars in thousands unless otherwise indicated)
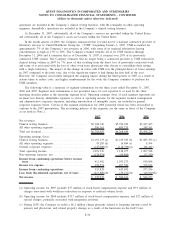
Condensed Consolidating Statement of Cash Flows
For the Year Ended December 31, 2006
Parent
Subsidiary
Guarantors
Non-
Guarantor
Subsidiaries Eliminations Consolidated
Cash flows from operating activities:
Net income . . . ............................. $ 586,421 $ 144,861 $ 113,742 $(258,603) $ 586,421
Adjustments to reconcile net income to net
cash provided by operating activities:
Depreciation and amortization . ........... 46,674 140,103 10,621 - 197,398
Provision for doubtful accounts........... 5,934 51,258 186,251 - 243,443
Provision for restructuring and other
special charges ........................ - 47,868 7,920 - 55,788
Other, net . . ............................. (316,207) 55,233 22,948 258,603 20,577
Changes in operating assets and liabilities. 200,269 (129,327) (222,673) - (151,731)
Net cash provided by operating activities. . . . 523,091 309,996 118,809 - 951,896
Net cash used in investing activities ........ (13,177) (120,444) (9,748) (271,033) (414,402)
Net cash used in financing activities ........ (452,257) (186,650) (112,110) 271,033 (479,984)
Net change in cash and cash equivalents . . . . 57,657 2,902 (3,049) - 57,510
Cash and cash equivalents, beginning of
year .................................... 76,941 4,759 10,430 - 92,130
Cash and cash equivalents, end of year . . . . . $ 134,598 $ 7,661 $ 7,381 $ - $ 149,640
Condensed Consolidating Statement of Cash Flows
For the Year Ended December 31, 2005
Parent
Subsidiary
Guarantors
Non-
Guarantor
Subsidiaries Eliminations Consolidated
Cash flows from operating activities:
Net income .............................. $ 546,277 $ 168,221 $ 58,606 $(226,827) $ 546,277
Adjustments to reconcile net income to
net cash provided by operating
activities:
Depreciation and amortization .......... 51,943 113,506 10,675 - 176,124
Provision for doubtful accounts ......... 5,659 43,669 184,300 - 233,628
Other, net ............................. (203,458) 33,809 20,511 226,827 77,689
Changes in operating assets and
liabilities ............................ 174,884 (214,707) (142,312) - (182,135)
Net cash provided by operating activities . . 575,305 144,498 131,780 - 851,583
Net cash used in investing activities....... (1,020,236) (176,202) (15,243) 131,888 (1,079,793)
Net cash provided by (used in) financing
activities .............................. 465,448 30,405 (116,927) (131,888) 247,038
Net change in cash and cash equivalents . . 20,517 (1,299) (390) - 18,828
Cash and cash equivalents, beginning of
year ................................... 56,424 6,058 10,820 - 73,302
Cash and cash equivalents, end of year. . . . $ 76,941 $ 4,759 $ 10,430 $ - $ 92,130
F-41