Quest Diagnostics 2007 Annual Report Download - page 109
Download and view the complete annual report
Please find page 109 of the 2007 Quest Diagnostics annual report below. You can navigate through the pages in the report by either clicking on the pages listed below, or by using the keyword search tool below to find specific information within the annual report.-
 1
1 -
2
-
3
-
4
-
5
-
6
-
7
-
8
-
9
-
10
-
11
-
12
-
13
-
14
-
15
-
16
-
17
-
18
-
19
-
20
-
21
-
22
-
23
-
24
-
25
-
26
-
27
-
28
-
29
-
30
-
31
-
32
-
33
-
34
-
35
-
36
-
37
-
38
-
39
-
40
-
41
-
42
-
43
-
44
-
45
-
46
-
47
-
48
-
49
-
50
-
51
-
52
-
53
-
54
-
55
-
56
-
57
-
58
-
59
-
60
-
61
-
62
-
63
-
64
-
65
-
66
-
67
-
68
-
69
-
70
-
71
-
72
-
73
-
74
-
75
-
76
-
77
-
78
-
79
-
80
-
81
-
82
-
83
-
84
-
85
-
86
-
87
-
88
-
89
-
90
-
91
-
92
-
93
-
94
-
95
-
96
-
97
-
98
-
 99
99 -
 100
100 -
 101
101 -
 102
102 -
 103
103 -
 104
104 -
 105
105 -
 106
106 -
 107
107 -
 108
108 -
 109
109 -
 110
110 -
 111
111 -
 112
112 -
 113
113 -
 114
114 -
 115
115 -
 116
116 -
 117
117 -
 118
118 -
 119
119 -
120
 |
 |

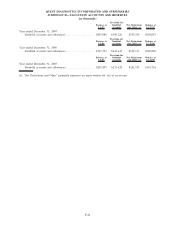
QUEST DIAGNOSTICS INCORPORATED AND SUBSIDIARIES
NOTES TO CONSOLIDATED FINANCIAL STATEMENTS - CONTINUED
(dollars in thousands unless otherwise indicated)
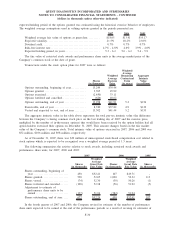
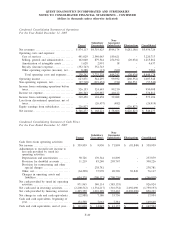
Condensed Consolidating Statement of Operations
For the Year Ended December 31, 2007
Parent
Subsidiary
Guarantors
Non-
Guarantor
Subsidiaries Eliminations Consolidated
Net revenues . ............................. $ 821,908 $5,488,797 $715,478 $(321,276) $6,704,907
Operating costs and expenses:
Cost of services ......................... 458,544 3,265,817 245,487 - 3,969,848
Selling, general and administrative........ 162,857 1,153,522 319,934 (23,455) 1,612,858
Amortization of intangible assets ......... 222 21,013 6,669 - 27,904
Royalty (income) expense ................ (393,975) 393,975 - - -
Other operating expense (income), net . . . . 51 (2,578) 5,488 - 2,961
Total operating costs and expenses ..... 227,699 4,831,749 577,578 (23,455) 5,613,571
Operating income .......................... 594,209 657,048 137,900 (297,821) 1,091,336
Non-operating expense, net ................. (178,849) (282,187) (15,719) 297,821 (178,934)
Income from continuing operations before
taxes.................................... 415,360 374,861 122,181 - 912,402
Income tax expense ........................ 157,270 150,994 50,310 - 358,574
Income from continuing operations ......... 258,090 223,867 71,871 - 553,828
Income (loss) from discontinued operations,
net of taxes ............................. - (213,917) 28 - (213,889)
Equity earnings from subsidiaries . .......... 81,849 - - (81,849) -
Net income . . . ............................. $ 339,939 $ 9,950 $ 71,899 $ (81,849) $ 339,939
Condensed Consolidating Statement of Operations
For the Year Ended December 31, 2006
Parent
Subsidiary
Guarantors
Non-
Guarantor
Subsidiaries Eliminations Consolidated
Net revenues . ............................. $ 942,692 $4,995,640 $710,692 $(380,365) $6,268,659
Operating costs and expenses:
Cost of services ......................... 501,942 2,958,591 235,473 - 3,696,006
Selling, general and administrative........ 147,862 1,020,774 264,488 (22,408) 1,410,716
Amortization of intangible assets ......... 1,451 8,924 468 - 10,843
Royalty (income) expense ................ (394,693) 394,693 - - -
Other operating (income) expense, net . . . . (3,358) 24,704 1,671 - 23,017
Total operating costs and expenses ..... 253,204 4,407,686 502,100 (22,408) 5,140,582
Operating income .......................... 689,488 587,954 208,592 (357,957) 1,128,077
Non-operating (expense) income, net........ (160,244) (295,672) 3,155 357,957 (94,804)
Income from continuing operations before
taxes.................................... 529,244 292,282 211,747 - 1,033,273
Income tax expense ........................ 201,426 118,441 87,714 - 407,581
Income from continuing operations ......... 327,818 173,841 124,033 - 625,692
Loss from discontinued operations, net of
taxes.................................... - (28,980) (10,291) - (39,271)
Equity earnings from subsidiaries . .......... 258,603 - - (258,603) -
Net income . . . ............................. $ 586,421 $ 144,861 $113,742 $(258,603) $ 586,421
F-39