Quest Diagnostics 2007 Annual Report Download - page 106
Download and view the complete annual report
Please find page 106 of the 2007 Quest Diagnostics annual report below. You can navigate through the pages in the report by either clicking on the pages listed below, or by using the keyword search tool below to find specific information within the annual report.-
 1
1 -
2
-
3
-
4
-
5
-
6
-
7
-
8
-
9
-
10
-
11
-
12
-
13
-
14
-
15
-
16
-
17
-
18
-
19
-
20
-
21
-
22
-
23
-
24
-
25
-
26
-
27
-
28
-
29
-
30
-
31
-
32
-
33
-
34
-
35
-
36
-
37
-
38
-
39
-
40
-
41
-
42
-
43
-
44
-
45
-
46
-
47
-
48
-
49
-
50
-
51
-
52
-
53
-
54
-
55
-
56
-
57
-
58
-
59
-
60
-
61
-
62
-
63
-
64
-
65
-
66
-
67
-
68
-
69
-
70
-
71
-
72
-
73
-
74
-
75
-
76
-
77
-
78
-
79
-
80
-
81
-
82
-
83
-
84
-
85
-
86
-
87
-
88
-
89
-
90
-
91
-
92
-
93
-
94
-
95
-
 96
96 -
 97
97 -
 98
98 -
 99
99 -
 100
100 -
 101
101 -
 102
102 -
 103
103 -
 104
104 -
 105
105 -
 106
106 -
 107
107 -
 108
108 -
 109
109 -
 110
110 -
 111
111 -
 112
112 -
 113
113 -
 114
114 -
 115
115 -
 116
116 -
117
-
118
-
119
-
120
 |
 |

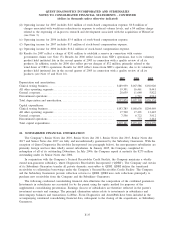
operations are included in the Company’s clinical testing business, with the remainder in other operating
segments. AmeriPath’s operations are included in the Company’s clinical testing business.
At December 31, 2007, substantially all of the Company’s services are provided within the United States,
and substantially all of the Company’s assets are located within the United States.
In the fourth quarter of 2006, the Company announced that it would not be a national contracted provider of
laboratory services to United Healthcare Group Inc. (“UNH”) beginning January 1, 2007. UNH accounted for
approximately 7% of the Company’s net revenues in 2006, with some of its regional laboratories having
concentrations as high as 15% to 20%. The Company retained virtually all of its UNH business through
December 31, 2006 and it estimates that as of December 31, 2007, it retained over 20% of its previously
contracted UNH volume. The Company estimates that no longer being a contracted provider to UNH reduced its
clinical testing volume in 2007 by 7%, most of that resulting from the direct loss of previously contracted work,
and some of it associated with the loss of other work from physicians who choose to consolidate their testing
with a single laboratory. The impact of the change in status with UNH was the principal driver of lower earnings
in 2007 compared to the prior year, due to the significant impact it had during the first half of the year.
However, the Company successfully mitigated the ongoing impact during the third quarter of 2007 as a result of
actions taken to reduce costs, and higher reimbursement for the work the Company continues to perform for
UNH members.
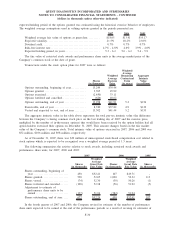
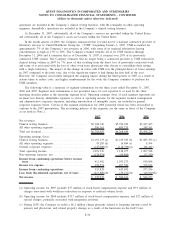
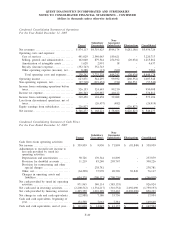
The following table is a summary of segment information for the three years ended December 31, 2007,
2006 and 2005. Segment asset information is not presented since it is not reported to or used by the chief
operating decision maker at the operating segment level. Operating earnings (loss) of each segment represents net
revenues less directly identifiable expenses to arrive at operating income for the segment. General management
and administrative corporate expenses, including amortization of intangible assets, are included in general
corporate expenses below. Certain of the segment information for 2006 presented below has been reclassified to
conform to the 2007 presentation. The accounting policies of the segments are the same as those of the Company
as set forth in Note 2.
2007 2006 2005
Net revenues:
Clinical testing business ............................. $6,108,746 $5,782,926 $5,247,465
All other operating segments......................... 596,161 485,733 209,261
Total net revenues................................... $6,704,907 $6,268,659 $5,456,726
Operating earnings (loss):
Clinical testing business ............................. $1,191,139 (a) $1,230,383 (b) $1,083,395 (c)
All other operating segments......................... 45,285 (d) 16,484 (e) 8,594
General corporate expenses .......................... (145,088)(f) (118,790)(g) (84,441)
Total operating income .............................. 1,091,336 1,128,077 1,007,548
Non-operating expenses, net ......................... (178,934) (94,804) (57,540)
Income from continuing operations before income
taxes ............................................. 912,402 1,033,273 950,008
Income tax expense ................................ 358,574 407,581 376,812
Income from continuing operations ................. 553,828 625,692 573,196
Loss from discontinued operations, net of taxes . . . . (213,889)(h) (39,271)(h) (26,919)(h)
Net income ......................................... $ 339,939 $ 586,421 $ 546,277
(a) Operating income for 2007 includes $37 million of stock-based compensation expense and $9.9 million of
charges associated with workforce reductions in response to reduced volume levels.
(b) Operating income for 2006 includes $33.7 million of stock-based compensation expense, and $27 million of
special charges, primarily associated with integration activities.
(c) During 2005, the Company recorded a $6.2 million charge primarily related to forgiving amounts owed by
patients and physicians, and related property damage as a result of the hurricanes in the Gulf Coast.
F-36
QUEST DIAGNOSTICS INCORPORATED AND SUBSIDIARIES
NOTES TO CONSOLIDATED FINANCIAL STATEMENTS - CONTINUED
(dollars in thousands unless otherwise indicated)