Quest Diagnostics 2007 Annual Report Download - page 66
Download and view the complete annual report
Please find page 66 of the 2007 Quest Diagnostics annual report below. You can navigate through the pages in the report by either clicking on the pages listed below, or by using the keyword search tool below to find specific information within the annual report.-
 1
1 -
2
-
3
-
4
-
5
-
6
-
7
-
8
-
9
-
10
-
11
-
12
-
13
-
14
-
15
-
16
-
17
-
18
-
19
-
20
-
21
-
22
-
23
-
24
-
25
-
26
-
27
-
28
-
29
-
30
-
31
-
32
-
33
-
34
-
35
-
36
-
37
-
38
-
39
-
40
-
41
-
42
-
43
-
44
-
45
-
46
-
47
-
48
-
49
-
50
-
51
-
52
-
53
-
54
-
55
-
 56
56 -
 57
57 -
 58
58 -
 59
59 -
 60
60 -
 61
61 -
 62
62 -
 63
63 -
 64
64 -
 65
65 -
 66
66 -
 67
67 -
 68
68 -
 69
69 -
 70
70 -
 71
71 -
 72
72 -
 73
73 -
 74
74 -
 75
75 -
 76
76 -
77
-
78
-
79
-
80
-
81
-
82
-
83
-
84
-
85
-
86
-
87
-
88
-
89
-
90
-
91
-
92
-
93
-
94
-
95
-
96
-
97
-
98
-
99
-
100
-
101
-
102
-
103
-
104
-
105
-
106
-
107
-
108
-
109
-
110
-
111
-
112
-
113
-
114
-
115
-
116
-
117
-
118
-
119
-
120
 |
 |
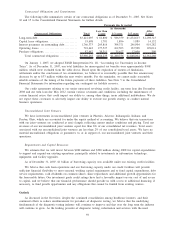
During the third quarter ended September 30, 2007, we entered into various variable-to-fixed interest rate
swap agreements, whereby we fixed the interest rates on $500 million of our term loan due May 2012 for
periods ranging from October 2007 through October 2009. The fixed interest rates range from 5.095% to 5.267%.
Based on our net exposure to interest rate changes, a hypothetical 10% change in interest rates on our variable
rate indebtedness (representing approximately 51 basis points) would impact annual net interest expense by
approximately $5 million, assuming no changes to the debt outstanding at December 31, 2007.
The fair value of the interest rate swap agreements at December 31, 2007 was not material. A hypothetical
10% decrease in interest rates on our term loan (representing approximately 43 basis points) would potentially
decrease the fair value of these instruments by approximately $3 million. A hypothetical 10% increase in interest
rates would potentially increase the fair value of these instruments by approximately $3 million. For details
regarding our outstanding debt and our financial instruments, see Notes 10 and 11 to the Consolidated Financial
Statements.
Risk Associated with Investment Portfolio
Our investment portfolio includes equity investments in publicly held companies that are classified as
available-for-sale securities and other strategic equity holdings in privately held companies. These securities are
exposed to price fluctuations and are generally concentrated in the life sciences industry. The carrying values of
our available-for-sale equity securities and privately held securities were $26.2 million at December 31, 2007.
We do not hedge our equity price risk. The impact of an adverse movement in equity prices on our holdings
in privately held companies cannot be easily quantified, as our ability to realize returns on investments depends
on, among other things, the enterprises’ ability to raise additional capital or derive cash inflows from continuing
operations or through liquidity events such as initial public offerings, mergers or private sales.
Liquidity and Capital Resources
Cash and Cash Equivalents
Cash and cash equivalents at December 31, 2007 totaled $168 million, compared to $150 million at
December 31, 2006. Cash flows from operating activities in 2007 were $927 million which, together with $850
million of cash flows from financing activities, were used to fund investing activities of $1.8 billion. Cash and
cash equivalents at December 31, 2006 totaled $150 million, compared to $92 million at December 31, 2005.
Cash flows from operating activities in 2006 were $952 million which were used to fund financing activities of
$480 million, and investing activities of $414 million.
Cash Flows from Operating Activities
Net cash provided by operating activities for 2007 was $927 million compared to $952 million in the prior
year period. This decrease was primarily due to lower earnings in the current year and increased payments
associated with variable compensation earned in the prior year, coupled with the payment of $57 million of fees
and other expenses associated with the acquisition of AmeriPath. Partially offsetting these items was a net source
of funds from reductions in net accounts receivable in the current year compared to a net use of funds in the
prior year. Days sales outstanding, a measure of billing and collection efficiency, were 48 days at December 31,
2007 unchanged from December 31, 2006, despite a two day increase due to the impact of AmeriPath. We
expect AmeriPath’s impact on our days sales outstanding to decrease over time.
Net cash provided by operating activities for 2006 was $952 million compared to $852 million in the prior
year period. This increase was primarily due to improved operating performance and the timing of various
payments for taxes and accrued expenses partially offset by an increase in accounts receivable. Days sales
outstanding were 48 days at December 31, 2006 compared to 46 days at December 31, 2005.
Cash Flows from Investing Activities
Net cash used in investing activities in 2007 was $1.8 billion, consisting primarily of $1.2 billion related to
the acquisition of AmeriPath, $309 million related to the acquisition of HemoCue and capital expenditures of
$219 million.
Net cash used in investing activities in 2006 was $414 million, consisting primarily of $231 million related
to the acquisitions of Focus Diagnostics and Enterix, and capital expenditures of $193 million. These amounts
were partially offset by $16 million of proceeds from the sale of an investment. The decrease in capital
57