Quest Diagnostics 2007 Annual Report Download - page 110
Download and view the complete annual report
Please find page 110 of the 2007 Quest Diagnostics annual report below. You can navigate through the pages in the report by either clicking on the pages listed below, or by using the keyword search tool below to find specific information within the annual report.-
 1
1 -
2
-
3
-
4
-
5
-
6
-
7
-
8
-
9
-
10
-
11
-
12
-
13
-
14
-
15
-
16
-
17
-
18
-
19
-
20
-
21
-
22
-
23
-
24
-
25
-
26
-
27
-
28
-
29
-
30
-
31
-
32
-
33
-
34
-
35
-
36
-
37
-
38
-
39
-
40
-
41
-
42
-
43
-
44
-
45
-
46
-
47
-
48
-
49
-
50
-
51
-
52
-
53
-
54
-
55
-
56
-
57
-
58
-
59
-
60
-
61
-
62
-
63
-
64
-
65
-
66
-
67
-
68
-
69
-
70
-
71
-
72
-
73
-
74
-
75
-
76
-
77
-
78
-
79
-
80
-
81
-
82
-
83
-
84
-
85
-
86
-
87
-
88
-
89
-
90
-
91
-
92
-
93
-
94
-
95
-
96
-
97
-
98
-
99
-
 100
100 -
 101
101 -
 102
102 -
 103
103 -
 104
104 -
 105
105 -
 106
106 -
 107
107 -
 108
108 -
 109
109 -
 110
110 -
 111
111 -
 112
112 -
 113
113 -
 114
114 -
 115
115 -
 116
116 -
 117
117 -
 118
118 -
 119
119 -
 120
120
 |
 |

QUEST DIAGNOSTICS INCORPORATED AND SUBSIDIARIES
NOTES TO CONSOLIDATED FINANCIAL STATEMENTS - CONTINUED
(dollars in thousands unless otherwise indicated)
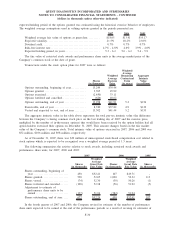
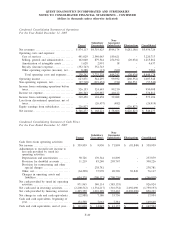
Condensed Consolidating Statement of Operations
For the Year Ended December 31, 2005
Parent
Subsidiary
Guarantors
Non-
Guarantor
Subsidiaries Eliminations Consolidated
Net revenues . ............................. $ 874,113 $4,319,625 $544,174 $(281,186) $5,456,726
Operating costs and expenses:
Cost of services ......................... 491,029 2,540,063 189,621 - 3,220,713
Selling, general and administrative........ 102,040 879,544 254,912 (20,634) 1,215,862
Amortization of intangible assets ......... 1,628 2,991 18 - 4,637
Royalty (income) expense ................ (352,743) 352,743 - - -
Other operating expense (income), net . . . . 8,288 (13) (309) - 7,966
Total operating costs and expenses ..... 250,242 3,775,328 444,242 (20,634) 4,449,178
Operating income .......................... 623,871 544,297 99,932 (260,552) 1,007,548
Non-operating expenses, net ................ (97,718) (219,652) (722) 260,552 (57,540)
Income from continuing operations before
taxes.................................... 526,153 324,645 99,210 - 950,008
Income tax expense ........................ 206,703 129,987 40,122 - 376,812
Income from continuing operations ......... 319,450 194,658 59,088 - 573,196
Loss from discontinued operations, net of
taxes.................................... - (26,437) (482) - (26,919)
Equity earnings from subsidiaries . .......... 226,827 - - (226,827) -
Net income . . . ............................. $ 546,277 $ 168,221 $ 58,606 $(226,827) $ 546,277
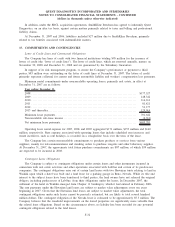
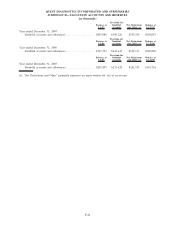
Condensed Consolidating Statement of Cash Flows
For the Year Ended December 31, 2007
Parent
Subsidiary
Guarantors
Non-
Guarantor
Subsidiaries Eliminations Consolidated
Cash flows from operating activities:
Net income ............................. $ 339,939 $ 9,950 $ 71,899 $ (81,849) $ 339,939
Adjustments to reconcile net income to
net cash provided by (used in)
operating activities:
Depreciation and amortization . . ....... 50,726 170,344 16,809 - 237,879
Provision for doubtful accounts . ....... 11,219 83,240 205,767 - 300,226
Provision for restructuring and other
special charges ..................... - 238,781 - - 238,781
Other, net. . . . ......................... (64,298) 37,970 20,596 81,849 76,117
Changes in operating assets and
liabilities . . ......................... 634,379 (200,171) (700,226) - (266,018)
Net cash provided by (used in) operating
activities.............................. 971,965 340,114 (385,155) - 926,924
Net cash used in investing activities ...... (2,200,512) (1,334,217) (316,554) 2,092,090 (1,759,193)
Net cash provided by financing activities . 1,205,559 1,001,289 735,465 (2,092,090) 850,223
Net change in cash and cash equivalents. . (22,988) 7,186 33,756 - 17,954
Cash and cash equivalents, beginning of
year .................................. 134,598 7,661 7,381 - 149,640
Cash and cash equivalents, end of year . . . $ 111,610 $ 14,847 $ 41,137 $ - $ 167,594
F-40