Pentax 2013 Annual Report Download - page 70
Download and view the complete annual report
Please find page 70 of the 2013 Pentax annual report below. You can navigate through the pages in the report by either clicking on the pages listed below, or by using the keyword search tool below to find specific information within the annual report.-
 1
1 -
2
-
3
-
4
-
5
-
6
-
7
-
8
-
9
-
10
-
11
-
12
-
13
-
14
-
15
-
16
-
17
-
18
-
19
-
20
-
21
-
22
-
23
-
24
-
25
-
26
-
27
-
28
-
29
-
30
-
31
-
32
-
33
-
34
-
35
-
36
-
37
-
38
-
39
-
40
-
41
-
42
-
43
-
44
-
45
-
46
-
47
-
48
-
49
-
50
-
51
-
52
-
53
-
54
-
55
-
56
-
57
-
58
-
59
-
 60
60 -
 61
61 -
 62
62 -
 63
63 -
 64
64 -
 65
65 -
 66
66 -
 67
67 -
 68
68 -
 69
69 -
 70
70 -
 71
71 -
 72
72 -
 73
73 -
 74
74 -
 75
75 -
 76
76 -
 77
77 -
 78
78 -
 79
79 -
 80
80 -
81
-
82
 |
 |
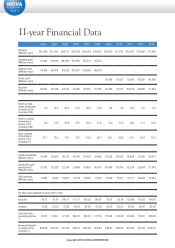
11-year Financial Data
Copyright 2013 © HOYA CORPORATION
2003 2004 2005 2006 2007 2008 2009 2010 2011 2012 2013
Price to earnings
ratio (PER) 41.8 28.9 20.4 27.7 20.2 12.4 28.4 27.0 13.7 18.6 10.6
Price to cash flow
ratio (PCFR) 21.6 14.5 17.2 19.7 17.1 8.4 9.0 13.3 8.9 10.9 8.5
Price to per-share
assets attributable
to owners of the
Company ratio
(PBR)
3.7 5.2 4.7 7.3 4.6 2.6 2.4 3.1 2.2 2.1 1.6
Stock price at year-
end (Yen) 1,787 2,537 2,950 4,750 3,910 2,340 1,930 2,569 1,898 1,859 1,752
Number of
employees 14,023 18,092 21,234 25,176 28,450 35,545 34,592 34,450 36,547 32,363 35,130
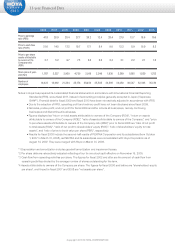
Notes: • Hoya has prepared its consolidated financial statements in accordance with International Financial Reporting
Standards (IFRS), since fiscal 2011, instead of accounting principles generally accepted in Japan ("Japanese
GAAP"). Financial data for fiscal 2009 and fiscal 2010 have been retroactively adjusted in accordance with IFRS.
• Due to the adoption of IFRS, operating profit and ordinary profit have not been disclosed since fiscal 2009.
• Net sales, pretax profit, and net profit for fiscal 2009 and after include all businesses, namely continuing
businesses and discontinued businesses.
• Figures displayed as "return on total assets attributable to owners of the Company (ROA)", "return on assets
attributable to owners of the Company (ROE)", "ratio of assets attributable to owners of the Company", and "price
to per-share assets attributable to owners of the Company ratio (PBR)" prior to fiscal 2008 are "ratio of net profit
to total assets (ROA)", "ratio of net profit to shareholders' equity (ROE)", "ratio of shareholders' equity to total
assets", and "ratio of price to book value per share (PBR)", respectively.
• Results for fiscal 2008 include the second-half results of PENTAX Corporation and its subsidiaries (from October
1, 2007 to March 31, 2008), as PENTAX and its subsidiaries were consolidated with Hoya Corporation as of
August 14, 2007. They were merged with Hoya on March 31, 2008.
*1 Depreciation and amortization includes goodwill amortization and impairment losses.
*2 Per share data are retroactively adjusted reflecting a four for one stock split effective on November 15, 2005.
*3 Cash flow from operating activities per share: The figures for fiscal 2002 and after are the amount of cash flow from
operating activities divided by the average number of shares outstanding for the term.
*4 Assets attributable to owners of the Company per share: The figures for fiscal 2006 and before are "shareholders' equity
per share", and those for fiscal 2007 and 2008 are "net assets per share".