Pentax 2013 Annual Report Download - page 69
Download and view the complete annual report
Please find page 69 of the 2013 Pentax annual report below. You can navigate through the pages in the report by either clicking on the pages listed below, or by using the keyword search tool below to find specific information within the annual report.-
 1
1 -
2
-
3
-
4
-
5
-
6
-
7
-
8
-
9
-
10
-
11
-
12
-
13
-
14
-
15
-
16
-
17
-
18
-
19
-
20
-
21
-
22
-
23
-
24
-
25
-
26
-
27
-
28
-
29
-
30
-
31
-
32
-
33
-
34
-
35
-
36
-
37
-
38
-
39
-
40
-
41
-
42
-
43
-
44
-
45
-
46
-
47
-
48
-
49
-
50
-
51
-
52
-
53
-
54
-
55
-
56
-
57
-
58
-
 59
59 -
 60
60 -
 61
61 -
 62
62 -
 63
63 -
 64
64 -
 65
65 -
 66
66 -
 67
67 -
 68
68 -
 69
69 -
 70
70 -
 71
71 -
 72
72 -
 73
73 -
 74
74 -
 75
75 -
 76
76 -
 77
77 -
 78
78 -
 79
79 -
80
-
81
-
82
 |
 |
Copyright 2013 © HOYA CORPORATIONCopyright 2013 © HOYA CORPORATIONCopyright 2013 © HOYA CORPORATION
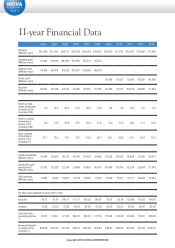
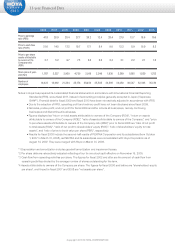
11-year Financial Data
2003 2004 2005 2006 2007 2008 2009 2010 2011 2012 2013
Net sales
(Millions of yen) 246,293 271,443 308,172 344,228 390,093 481,631 453,870 413,726 423,063 376,940 372,494
Operating profit
(Millions of yen) 52,982 68,166 84,920 101,095 107,213 95,073 - - - - -
Ordinary profit
(Millions of yen) 50,874 66,554 89,525 103,637 102,909 100,175 - - - - -
Pretax profit
(Millions of yen) 50,768 51,557 73,920 58,530 89,368
Net profit
(Millions of yen) 20,037 39,548 64,135 75,620 83,391 81,725 29,380 41,517 59,579 42,680 71,242
Return on total
assets attributable
to owners of the
Company (ROA)
7.3 14.0 20.0 21.2 20.6 14.4 4.6 7.4 10.5 7.5 11.9
Return on equity
attributable to
owners of the
Company (ROE)
9.0 17.8 25.8 27.1 25.9 21.6 8.0 11.8 16.3 11.3 16.6
Ratio of assets
attributable to
owners of the
Company (%)
81.7 75.5 79.1 77.3 81.6 56.7 56.1 63.8 65.1 66.9 76.2
Capital expenditure
(Millions of yen) 15,948 30,659 40,175 48,785 54,432 39,465 34,838 29,020 38,488 33,185 45,011
Depreciation and
amortization*1
(Millions of yen)
19,792 25,328 22,519 27,484 36,425 45,457 80,488 35,336 33,238 26,904 31,991
R&D expenses
(Millions of yen) 8,681 9,847 10,957 14,134 14,920 17,412 17,630 17,311 16,711 16,094 15,703
Per share data (adjusted for stock split)*2 (Yen)
Net profit 42.77 87.74 144.71 171.71 193.50 189.01 67.87 95.24 138.49 100.18 164.78
Dividend 12.50 25.00 37.50 60.00 65.00 65.00 65.00 65.00 65.00 65.00 65.00
Cash flow from
operating activities
*3
82.72 174.91 171.65 240.57 229.23 277.09 213.34 193.49 214.44 170.87 206.24
Assets attributable
to owners of the
Company *4
486.29 491.90 623.59 648.87 845.98 903.49 788.27 828.82 873.49 891.93 1,091.25