Panera Bread 2013 Annual Report Download - page 77
Download and view the complete annual report
Please find page 77 of the 2013 Panera Bread annual report below. You can navigate through the pages in the report by either clicking on the pages listed below, or by using the keyword search tool below to find specific information within the annual report.-
 1
1 -
2
-
3
-
4
-
5
-
6
-
7
-
8
-
9
-
10
-
11
-
12
-
13
-
14
-
15
-
16
-
17
-
18
-
19
-
20
-
21
-
22
-
23
-
24
-
25
-
26
-
27
-
28
-
29
-
30
-
31
-
32
-
33
-
34
-
35
-
36
-
37
-
38
-
39
-
40
-
41
-
42
-
43
-
44
-
45
-
46
-
47
-
48
-
49
-
50
-
51
-
52
-
53
-
54
-
55
-
56
-
57
-
58
-
59
-
60
-
61
-
62
-
63
-
64
-
65
-
66
-
 67
67 -
 68
68 -
 69
69 -
 70
70 -
 71
71 -
 72
72 -
 73
73 -
 74
74 -
 75
75 -
 76
76 -
 77
77 -
 78
78 -
 79
79 -
 80
80 -
 81
81 -
 82
82 -
 83
83 -
 84
84 -
 85
85 -
 86
86 -
 87
87 -
88
 |
 |

PANERA BREAD COMPANY
NOTES TO THE CONSOLIDATED FINANCIAL STATEMENTS (continued)
69
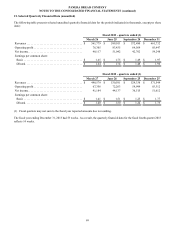
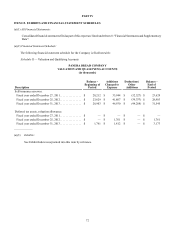
21. Selected Quarterly Financial Data (unaudited)
The following table presents selected unaudited quarterly financial data for the periods indicated (in thousands, except per share
data):
Fiscal 2013 - quarters ended (1)
March 26 June 25 September 24 December 31
Revenues . . . . . . . . . . . . . . . . . . . . . . . . . . . . . . . . . . . . . . . $ 561,779 $ 589,011 $ 572,480 $ 661,732
Operating profit . . . . . . . . . . . . . . . . . . . . . . . . . . . . . . . . . . 76,305 83,435 64,569 85,447
Net income. . . . . . . . . . . . . . . . . . . . . . . . . . . . . . . . . . . . . . 48,117 51,042 42,762 54,248
Earnings per common share:
Basic . . . . . . . . . . . . . . . . . . . . . . . . . . . . . . . . . . . . . . . . . $ 1.65 $ 1.75 $ 1.49 $ 1.97
Diluted. . . . . . . . . . . . . . . . . . . . . . . . . . . . . . . . . . . . . . . . $ 1.64 $ 1.74 $ 1.48 $ 1.96
Fiscal 2012 - quarters ended (1)
March 27 June 26 September 25 December 25
Revenues . . . . . . . . . . . . . . . . . . . . . . . . . . . . . . . . . . . . . . . $ 498,579 $ 530,591 $ 529,338 $ 571,549
Operating profit . . . . . . . . . . . . . . . . . . . . . . . . . . . . . . . . . . 67,356 72,203 59,999 83,312
Net income. . . . . . . . . . . . . . . . . . . . . . . . . . . . . . . . . . . . . . 41,184 44,137 36,515 51,612
Earnings per common share:
Basic . . . . . . . . . . . . . . . . . . . . . . . . . . . . . . . . . . . . . . . . . $ 1.41 $ 1.51 $ 1.25 $ 1.77
Diluted. . . . . . . . . . . . . . . . . . . . . . . . . . . . . . . . . . . . . . . . $ 1.40 $ 1.50 $ 1.24 $ 1.75
(1) Fiscal quarters may not sum to the fiscal year reported amounts due to rounding.
The fiscal year ending December 31, 2013 had 53 weeks. As a result, the quarterly financial data for the fiscal fourth quarter 2013
reflects 14 weeks.