Panera Bread 2013 Annual Report Download - page 33
Download and view the complete annual report
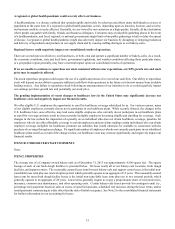
Please find page 33 of the 2013 Panera Bread annual report below. You can navigate through the pages in the report by either clicking on the pages listed below, or by using the keyword search tool below to find specific information within the annual report.-
 1
1 -
2
-
3
-
4
-
5
-
6
-
7
-
8
-
9
-
10
-
11
-
12
-
13
-
14
-
15
-
16
-
17
-
18
-
19
-
20
-
21
-
22
-
 23
23 -
 24
24 -
 25
25 -
 26
26 -
 27
27 -
 28
28 -
 29
29 -
 30
30 -
 31
31 -
 32
32 -
 33
33 -
 34
34 -
 35
35 -
 36
36 -
 37
37 -
 38
38 -
 39
39 -
 40
40 -
 41
41 -
 42
42 -
 43
43 -
44
-
45
-
46
-
47
-
48
-
49
-
50
-
51
-
52
-
53
-
54
-
55
-
56
-
57
-
58
-
59
-
60
-
61
-
62
-
63
-
64
-
65
-
66
-
67
-
68
-
69
-
70
-
71
-
72
-
73
-
74
-
75
-
76
-
77
-
78
-
79
-
80
-
81
-
82
-
83
-
84
-
85
-
86
-
87
-
88
 |
 |

25
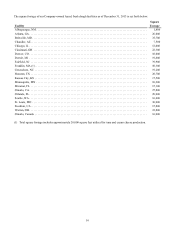
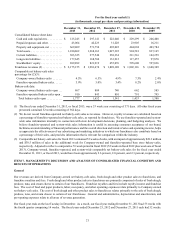
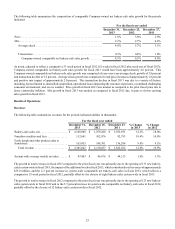
The following table summarizes the composition of comparable Company-owned net bakery-cafe sales growth for the periods
indicated:
For the fiscal year ended
December 31,
2013
December 25,
2012
December 27,
2011
Price . . . . . . . . . . . . . . . . . . . . . . . . . . . . . . . . . . . . . . . . . . . . . . . . . . . . . . . . 1.8% 3.0% 2.9%
Mix . . . . . . . . . . . . . . . . . . . . . . . . . . . . . . . . . . . . . . . . . . . . . . . . . . . . . . . . . 2.2% 2.7% 0.2%
Average check . . . . . . . . . . . . . . . . . . . . . . . . . . . . . . . . . . . . . . . . . . . . . . 4.0% 5.7% 3.1%
Transactions . . . . . . . . . . . . . . . . . . . . . . . . . . . . . . . . . . . . . . . . . . . . . . . . 0.5% 0.8% 1.8%
Company-owned comparable net bakery-cafe sales growth . . . . . . . . . 4.5% 6.5% 4.9%
As noted, adjusted to reflect a comparative 53 week period in fiscal 2012 (52 weeks in fiscal 2012 plus week one of fiscal 2013),
Company-owned comparable net bakery-cafe sales growth for fiscal 2013 would have been approximately 2.6 percent. This
Company-owned comparable net bakery-cafe sales growth was comprised of year-over-year average check growth of 3.8 percent
and transaction decline of 1.2 percent. Average check growth was comprised of retail price increases of approximately 1.8 percent
and positive mix impact of approximately 2.0 percent. This transaction decline in fiscal 2013 was due to a variety of factors,
including, but not limited to, intensified competition, operational issues impacting the customer experience, a continued challenging
consumer environment, and severe weather. Price growth in fiscal 2013 was modest as compared to the prior fiscal years due to
lower commodity inflation. Mix growth in fiscal 2013 was modest as compared to fiscal 2012 due, in part, to slower catering
sales growth in fiscal 2013.
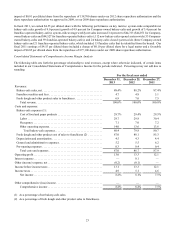
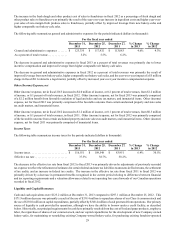
Results of Operations
Revenues
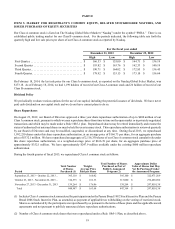
The following table summarizes revenues for the periods indicated (dollars in thousands):
For the fiscal year ended
December 31,
2013
December 25,
2012
December 27,
2011
% Change
in 2013
% Change
in 2012
Bakery-cafe sales, net . . . . . . . . . . . . . . . . . . . $ 2,108,908 $ 1,879,280 $ 1,592,951 12.2% 18.0%
Franchise royalties and fees . . . . . . . . . . . . . . 112,641 102,076 92,793 10.4% 10.0%
Fresh dough and other product sales to
franchisees. . . . . . . . . . . . . . . . . . . . . . . . . . . . 163,453 148,701 136,288 9.9% 9.1%
Total revenue . . . . . . . . . . . . . . . . . . . . . . . $ 2,385,002 $ 2,130,057 $ 1,822,032 12.0% 16.9%
System-wide average weekly net sales . . . . . . $ 47,403 $ 46,676 $ 44,313 1.6% 5.3%
The growth in total revenues in fiscal 2013 compared to the prior fiscal year was primarily due to the opening of 133 new bakery-
cafes system-wide in fiscal 2013, the impact of the additional week in fiscal 2013, which contributed total revenues of approximately
$35.0 million, and the 2.3 percent increase in system-wide comparable net bakery-cafe sales in fiscal 2013, which reflects a
comparative 53 week period in fiscal 2012, partially offset by the closure of eight bakery-cafes system-wide in fiscal 2013.
The growth in total revenues in fiscal 2012 compared to the prior fiscal year was primarily due to the opening of 123 new bakery-
cafes system-wide in fiscal 2012 and to the 5.7 percent increase in system-wide comparable net bakery-cafe sales in fiscal 2012,
partially offset by the closure of 12 bakery-cafes system-wide in fiscal 2012.