Panera Bread 2013 Annual Report Download - page 37
Download and view the complete annual report
Please find page 37 of the 2013 Panera Bread annual report below. You can navigate through the pages in the report by either clicking on the pages listed below, or by using the keyword search tool below to find specific information within the annual report.-
 1
1 -
2
-
3
-
4
-
5
-
6
-
7
-
8
-
9
-
10
-
11
-
12
-
13
-
14
-
15
-
16
-
17
-
18
-
19
-
20
-
21
-
22
-
23
-
24
-
25
-
26
-
 27
27 -
 28
28 -
 29
29 -
 30
30 -
 31
31 -
 32
32 -
 33
33 -
 34
34 -
 35
35 -
 36
36 -
 37
37 -
 38
38 -
 39
39 -
 40
40 -
 41
41 -
 42
42 -
 43
43 -
 44
44 -
 45
45 -
 46
46 -
 47
47 -
48
-
49
-
50
-
51
-
52
-
53
-
54
-
55
-
56
-
57
-
58
-
59
-
60
-
61
-
62
-
63
-
64
-
65
-
66
-
67
-
68
-
69
-
70
-
71
-
72
-
73
-
74
-
75
-
76
-
77
-
78
-
79
-
80
-
81
-
82
-
83
-
84
-
85
-
86
-
87
-
88
 |
 |

29
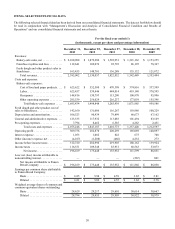
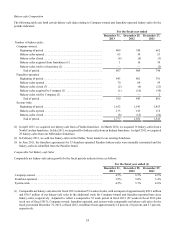
The increase in the fresh dough and other product cost of sales to franchisees in fiscal 2012 as a percentage of fresh dough and
other product sales to franchisees was primarily the result of the year-over-year increase in ingredient costs and higher year-over-
year sales of zero margin fresh produce sales to franchisees, partially offset by improved leverage from new bakery-cafes and
higher comparable net bakery-cafe sales.
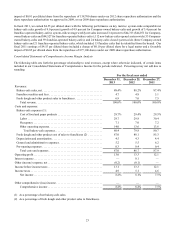
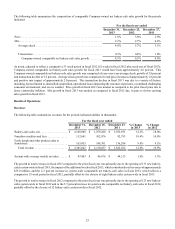
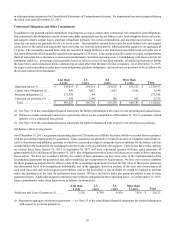
The following table summarizes general and administrative expenses for the periods indicated (dollars in thousands):
For the fiscal year ended
December 31,
2013
December 25,
2012
December 27,
2011
% Change
in 2013
% Change
in 2012
General and administrative expenses . . . . . . . $ 123,335 $ 117,932 $ 113,083 4.6% 4.3%
As a percent of total revenue. . . . . . . . . . . . . . 5.2% 5.5% 6.2%
The decrease in general and administrative expenses in fiscal 2013 as a percent of total revenues was primarily due to lower
incentive compensation and improved leverage from higher comparable net bakery-cafe sales.
The decrease in general and administrative expenses in fiscal 2012 as a percent of total revenues was primarily the result of
improved leverage from new bakery-cafes, higher comparable net bakery-cafe sales, and the year-over-year impact of a $5 million
charge in fiscal 2011 related to a legal matter, partially offset by increased year-over-year incentive compensation expense.
Other (Income) Expense, net
Other (income) expense, net in fiscal 2013 increased to $4.0 million of income, or 0.2 percent of total revenues, from $1.2 million
of income, or 0.1 percent of total revenues, in fiscal 2012. Other (income) expense, net for fiscal 2013 was primarily comprised
of a $2.2 million benefit from favorable resolution of legal and sales and use tax matters, and immaterial items. Other (income)
expense, net for fiscal 2012 was primarily comprised of the favorable outcome from certain unclaimed property and state sales
tax audit matters, and immaterial items.
Other (income) expense, net in fiscal 2012 increased to $1.2 million of income, or 0.1 percent of total revenues, from $0.5 million
of income, or 0.1 percent of total revenues, in fiscal 2011. Other (income) expense, net for fiscal 2012 was primarily comprised
of the favorable outcome from certain unclaimed property and state sales tax audit matters, and immaterial items. Other (income)
expense, net for fiscal 2011 was primarily comprised of immaterial items.
Income Taxes
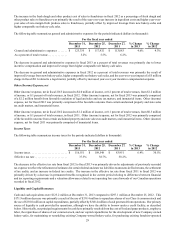
The following table summarizes income taxes for the periods indicated (dollars in thousands):
For the fiscal year ended
December 31,
2013
December 25,
2012
December 27,
2011
% Change
in 2013
% Change
in 2012
Income taxes . . . . . . . . . . . . . . . . . . . . . . . . . . $ 116,551 $ 109,548 $ 83,951 6.4% 30.5%
Effective tax rate . . . . . . . . . . . . . . . . . . . . . . . 37.3% 38.7% 38.2%
The decrease in the effective tax rate from fiscal 2012 to fiscal 2013 was primarily driven by adjustments of previously recorded
tax expense to reflect the refinement of estimates for certain federal and state tax liabilities to amounts in filed returns, the settlement
of tax audits, and an increase in federal tax credits. The increase in the effective tax rate from fiscal 2011 to fiscal 2012 was
primarily driven by a decrease in permanent benefits recognized in the current period relating to differences between financial
and tax reporting requirements and a valuation allowance related to net operating loss carryforwards of our Canadian operations
recorded in fiscal 2012.
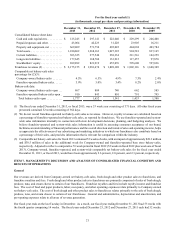
Liquidity and Capital Resources
Cash and cash equivalents were $125.2 million at December 31, 2013 compared to $297.1 million at December 25, 2012. This
$171.9 million decrease was primarily a result of the use of $339.4 million to repurchase shares of our Class A common stock and
the use of $192.0 million on capital expenditures, partially offset by $348.4 million of cash generated from operations. Our primary
source of liquidity is cash provided by operations, although we have the ability to borrow under a credit facility, as described
below. Historically, our principal requirements for cash have primarily resulted from the cost of food and paper products, employee
labor, the repurchase of shares of our common stock, and our capital expenditures for the development of new Company-owned
bakery-cafes, for maintaining or remodeling existing Company-owned bakery-cafes, for purchasing existing franchise-operated