Panera Bread 2013 Annual Report Download - page 38
Download and view the complete annual report
Please find page 38 of the 2013 Panera Bread annual report below. You can navigate through the pages in the report by either clicking on the pages listed below, or by using the keyword search tool below to find specific information within the annual report.-
 1
1 -
2
-
3
-
4
-
5
-
6
-
7
-
8
-
9
-
10
-
11
-
12
-
13
-
14
-
15
-
16
-
17
-
18
-
19
-
20
-
21
-
22
-
23
-
24
-
25
-
26
-
27
-
 28
28 -
 29
29 -
 30
30 -
 31
31 -
 32
32 -
 33
33 -
 34
34 -
 35
35 -
 36
36 -
 37
37 -
 38
38 -
 39
39 -
 40
40 -
 41
41 -
 42
42 -
 43
43 -
 44
44 -
 45
45 -
 46
46 -
 47
47 -
 48
48 -
49
-
50
-
51
-
52
-
53
-
54
-
55
-
56
-
57
-
58
-
59
-
60
-
61
-
62
-
63
-
64
-
65
-
66
-
67
-
68
-
69
-
70
-
71
-
72
-
73
-
74
-
75
-
76
-
77
-
78
-
79
-
80
-
81
-
82
-
83
-
84
-
85
-
86
-
87
-
88
 |
 |

30
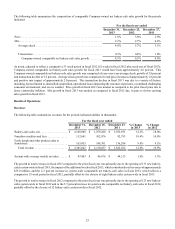
bakery-cafes or ownership interests in other restaurant or bakery-cafe concepts, for developing, maintaining, or remodeling fresh
dough facilities, and for other capital needs such as enhancements to information systems and other infrastructure.
We had negative working capital of $0.6 million at December 31, 2013 compared to positive working capital of $201.3 million
at December 25, 2012. The decrease in working capital resulted primarily from the previously described decrease in cash and
cash equivalents of $171.9 million and an increase in accrued expenses of $17.6 million and accounts payable of $8.2 million.
We believe that cash provided by our operations and available borrowings under our credit facility will be sufficient to fund our
cash requirements for the foreseeable future. We have not required significant working capital because customers generally pay
using cash or credit and debit cards and because our operations do not require significant receivables, nor do they require significant
inventories due, in part, to our use of various fresh ingredients.
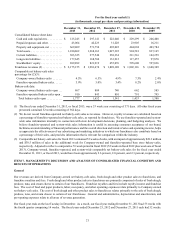
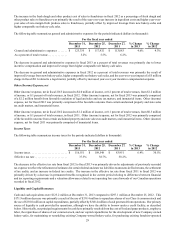
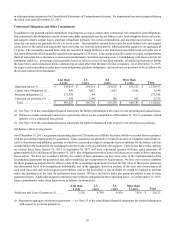
A summary of our cash flows, for the periods indicated, are as follows (in thousands):
For the fiscal year ended
Cash provided by (used in):
December 31,
2013
December 25,
2012
December 27,
2011
Operating activities . . . . . . . . . . . . . . . . . . . . . . . . . . . . . . . . . . . . . $ 348,417 $ 289,456 $ 236,889
Investing activities . . . . . . . . . . . . . . . . . . . . . . . . . . . . . . . . . . . . . . (188,307)(195,741)(152,194)
Financing activities . . . . . . . . . . . . . . . . . . . . . . . . . . . . . . . . . . . . . (332,006)(19,214)(91,354)
Net increase (decrease) in cash and cash equivalents . . . . . . . . . . $ (171,896) $ 74,501 $ (6,659)
Operating Activities
Cash provided by operating activities was $348.4 million, $289.5 million, and $236.9 million in fiscal 2013, fiscal 2012, and fiscal
2011, respectively. Cash provided by operating activities consists primarily of net income, adjusted for non-cash expenses such
as depreciation and amortization, and the net change in operating assets and liabilities.
Cash provided by operating activities in fiscal 2013 consisted primarily of net income adjusted for non-cash expenses and an
increase in accrued expenses and accounts payable. The increase in accrued expenses was primarily due to an increase in the
balance of outstanding gift cards. The increase in accounts payable was primarily due to the timing of payments.
Cash provided by operating activities in fiscal 2012 consisted primarily of net income adjusted for non-cash expenses and an
increase in accrued expenses, partially offset by an increase in trade and other accounts receivable and prepaid expenses. The
increase in accrued expenses was primarily due to an increase in the balance of outstanding gift cards and higher incentive
compensation accruals. The increase in trade and other accounts receivable was primarily due to an increase in credit card and
other receivables due to the timing of the holidays near our 2012 fiscal year end and an increase in refundable income taxes due
to the timing of payments. The increase in prepaid expenses was primarily due to the timing of rent and insurance premium
prepayments.
Cash provided by operating activities in fiscal 2011 consisted primarily of net income adjusted for non-cash expenses and an
increase in accrued expenses, partially offset by an increase in trade and other accounts receivable and prepaid expenses. The
increase in accrued expenses was primarily due to an increase in the balance of outstanding gift cards. The increase in trade and
other accounts receivable was primarily due to an increase in credit card and other receivables due to the timing of the holidays
near our fiscal year end. The increase in prepaid expenses was primarily due to timing and an increase in insurance premium
prepayments.
Investing Activities
Cash used in investing activities was $188.3 million, $195.7 million, and $152.2 million in fiscal 2013, fiscal 2012, and fiscal
2011, respectively. Cash used in investing activities consists primarily of capital expenditures and cash used in business
combinations.