Panera Bread 2013 Annual Report Download - page 50
Download and view the complete annual report
Please find page 50 of the 2013 Panera Bread annual report below. You can navigate through the pages in the report by either clicking on the pages listed below, or by using the keyword search tool below to find specific information within the annual report.-
 1
1 -
2
-
3
-
4
-
5
-
6
-
7
-
8
-
9
-
10
-
11
-
12
-
13
-
14
-
15
-
16
-
17
-
18
-
19
-
20
-
21
-
22
-
23
-
24
-
25
-
26
-
27
-
28
-
29
-
30
-
31
-
32
-
33
-
34
-
35
-
36
-
37
-
38
-
39
-
 40
40 -
 41
41 -
 42
42 -
 43
43 -
 44
44 -
 45
45 -
 46
46 -
 47
47 -
 48
48 -
 49
49 -
 50
50 -
 51
51 -
 52
52 -
 53
53 -
 54
54 -
 55
55 -
 56
56 -
 57
57 -
 58
58 -
 59
59 -
 60
60 -
61
-
62
-
63
-
64
-
65
-
66
-
67
-
68
-
69
-
70
-
71
-
72
-
73
-
74
-
75
-
76
-
77
-
78
-
79
-
80
-
81
-
82
-
83
-
84
-
85
-
86
-
87
-
88
 |
 |

42
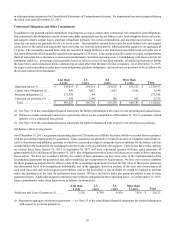
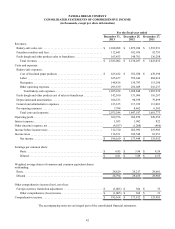
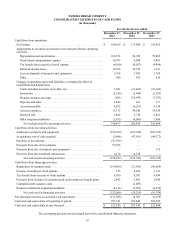
PANERA BREAD COMPANY
CONSOLIDATED STATEMENTS OF COMPREHENSIVE INCOME
(in thousands, except per share information)
For the fiscal year ended
December 31,
2013
December 25,
2012
December 27,
2011
Revenues:
Bakery-cafe sales, net . . . . . . . . . . . . . . . . . . . . . . . . . . . . . . . . . . . . . . . . . . $ 2,108,908 $ 1,879,280 $ 1,592,951
Franchise royalties and fees . . . . . . . . . . . . . . . . . . . . . . . . . . . . . . . . . . . . . 112,641 102,076 92,793
Fresh dough and other product sales to franchisees . . . . . . . . . . . . . . . . . . . 163,453 148,701 136,288
Total revenues . . . . . . . . . . . . . . . . . . . . . . . . . . . . . . . . . . . . . . . . . . . . . $ 2,385,002 $ 2,130,057 $ 1,822,032
Costs and expenses:
Bakery-cafe expenses:
Cost of food and paper products . . . . . . . . . . . . . . . . . . . . . . . . . . . . . . . $ 625,622 $ 552,580 $ 470,398
Labor . . . . . . . . . . . . . . . . . . . . . . . . . . . . . . . . . . . . . . . . . . . . . . . . . . . . 625,457 559,446 484,014
Occupancy . . . . . . . . . . . . . . . . . . . . . . . . . . . . . . . . . . . . . . . . . . . . . . . . 148,816 130,793 115,290
Other operating expenses. . . . . . . . . . . . . . . . . . . . . . . . . . . . . . . . . . . . . 295,539 256,029 216,237
Total bakery-cafe expenses. . . . . . . . . . . . . . . . . . . . . . . . . . . . . . . . . 1,695,434 1,498,848 1,285,939
Fresh dough and other product cost of sales to franchisees . . . . . . . . . . . . . 142,160 131,006 116,267
Depreciation and amortization . . . . . . . . . . . . . . . . . . . . . . . . . . . . . . . . . . . 106,523 90,939 79,899
General and administrative expenses . . . . . . . . . . . . . . . . . . . . . . . . . . . . . . 123,335 117,932 113,083
Pre-opening expenses . . . . . . . . . . . . . . . . . . . . . . . . . . . . . . . . . . . . . . . . . . 7,794 8,462 6,585
Total costs and expenses . . . . . . . . . . . . . . . . . . . . . . . . . . . . . . . . . . . . . 2,075,246 1,847,187 1,601,773
Operating profit. . . . . . . . . . . . . . . . . . . . . . . . . . . . . . . . . . . . . . . . . . . . . . . . 309,756 282,870 220,259
Interest expense. . . . . . . . . . . . . . . . . . . . . . . . . . . . . . . . . . . . . . . . . . . . . . . . 1,053 1,082 822
Other (income) expense, net . . . . . . . . . . . . . . . . . . . . . . . . . . . . . . . . . . . . . . (4,017)(1,208)(466)
Income before income taxes . . . . . . . . . . . . . . . . . . . . . . . . . . . . . . . . . . . . . . 312,720 282,996 219,903
Income taxes . . . . . . . . . . . . . . . . . . . . . . . . . . . . . . . . . . . . . . . . . . . . . . . . . . 116,551 109,548 83,951
Net income. . . . . . . . . . . . . . . . . . . . . . . . . . . . . . . . . . . . . . . . . . . . . . . . $ 196,169 $ 173,448 $ 135,952
Earnings per common share:
Basic. . . . . . . . . . . . . . . . . . . . . . . . . . . . . . . . . . . . . . . . . . . . . . . . . . . . . $ 6.85 $ 5.94 $ 4.59
Diluted . . . . . . . . . . . . . . . . . . . . . . . . . . . . . . . . . . . . . . . . . . . . . . . . . . . $ 6.81 $ 5.89 $ 4.55
Weighted average shares of common and common equivalent shares
outstanding:
Basic . . . . . . . . . . . . . . . . . . . . . . . . . . . . . . . . . . . . . . . . . . . . . . . . . . . . . . . 28,629 29,217 29,601
Diluted . . . . . . . . . . . . . . . . . . . . . . . . . . . . . . . . . . . . . . . . . . . . . . . . . . . . . 28,794 29,455 29,903
Other comprehensive income (loss), net of tax:
Foreign currency translation adjustment . . . . . . . . . . . . . . . . . . . . . . . . . . . $(1,005) $ 364 $ 33
Other comprehensive (loss) income. . . . . . . . . . . . . . . . . . . . . . . . . . . . . $(1,005) $ 364 $ 33
Comprehensive income. . . . . . . . . . . . . . . . . . . . . . . . . . . . . . . . . . . . . . . . . . $ 195,164 $ 173,812 $ 135,985
The accompanying notes are an integral part of the consolidated financial statements.