Panera Bread 2013 Annual Report Download - page 36
Download and view the complete annual report
Please find page 36 of the 2013 Panera Bread annual report below. You can navigate through the pages in the report by either clicking on the pages listed below, or by using the keyword search tool below to find specific information within the annual report.-
 1
1 -
2
-
3
-
4
-
5
-
6
-
7
-
8
-
9
-
10
-
11
-
12
-
13
-
14
-
15
-
16
-
17
-
18
-
19
-
20
-
21
-
22
-
23
-
24
-
25
-
 26
26 -
 27
27 -
 28
28 -
 29
29 -
 30
30 -
 31
31 -
 32
32 -
 33
33 -
 34
34 -
 35
35 -
 36
36 -
 37
37 -
 38
38 -
 39
39 -
 40
40 -
 41
41 -
 42
42 -
 43
43 -
 44
44 -
 45
45 -
 46
46 -
47
-
48
-
49
-
50
-
51
-
52
-
53
-
54
-
55
-
56
-
57
-
58
-
59
-
60
-
61
-
62
-
63
-
64
-
65
-
66
-
67
-
68
-
69
-
70
-
71
-
72
-
73
-
74
-
75
-
76
-
77
-
78
-
79
-
80
-
81
-
82
-
83
-
84
-
85
-
86
-
87
-
88
 |
 |

28
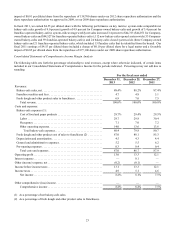
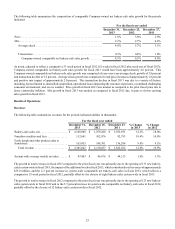
The following table summarizes labor expense for the periods indicated (dollars in thousands):
For the fiscal year ended
December 31,
2013
December 25,
2012
December 27,
2011
% Change
in 2013
% Change
in 2012
Labor expense . . . . . . . . . . . . . . . . . . . . . . . . . $ 625,457 $ 559,446 $ 484,014 11.8% 15.6%
As a percent of bakery-cafe sales, net. . . . . . . 29.7% 29.8% 30.4%
The decrease in labor expense in fiscal 2013 as a percentage of net bakery-cafe sales was primarily a result of lower incentive
compensation.
The decrease in labor expense in fiscal 2012 as a percentage of net bakery-cafe sales was primarily a result of improved leverage
from higher comparable net bakery-cafe sales and wage discipline.
The following table summarizes occupancy cost for the periods indicated (dollars in thousands):
For the fiscal year ended
December 31,
2013
December 25,
2012
December 27,
2011
% Change
in 2013
% Change
in 2012
Occupancy cost . . . . . . . . . . . . . . . . . . . . . . . . $ 148,816 $ 130,793 $ 115,290 13.8% 13.4%
As a percent of bakery-cafe sales, net. . . . . . . 7.1% 7.0% 7.2%
The increase in occupancy cost in fiscal 2013 as a percentage of net bakery-cafe sales was primarily a result of modestly higher
average occupancy costs in new bakery-cafes and higher real estate taxes.
The decrease in occupancy cost in fiscal 2012 as a percentage of net bakery-cafe sales was primarily a result of improved leverage
from higher comparable net bakery-cafe sales.
The following table summarizes other operating expenses for the periods indicated (dollars in thousands):
For the fiscal year ended
December 31,
2013
December 25,
2012
December 27,
2011
% Change
in 2013
% Change
in 2012
Other operating expenses . . . . . . . . . . . . . . . . $ 295,539 $ 256,029 $ 216,237 15.4% 18.4%
As a percent of bakery-cafe sales, net. . . . . . . 14.0% 13.6% 13.6%
The increase in other operating expenses in fiscal 2013 as a percentage of net bakery-cafe sales was primarily a result of increased
marketing expense and certain other controllable expenses, including increased repair and maintenance expenses related to
operational initiatives.
Other operating expenses remained consistent as a percentage of net bakery-cafe sales from fiscal 2011 to fiscal 2012 primarily
due to increased marketing expense, principally offset by leverage from higher comparable net bakery-cafe sales.
The following table summarizes fresh dough and other product cost of sales to franchisees for the periods indicated (dollars in
thousands):
For the fiscal year ended
December 31,
2013
December 25,
2012
December 27,
2011
% Change
in 2013
% Change
in 2012
Fresh dough and other product cost of sales
to franchisees. . . . . . . . . . . . . . . . . . . . . . . . . . $ 142,160 $ 131,006 $ 116,267 8.5% 12.7%
As a percent of fresh dough and other
product sales to franchisees. . . . . . . . . . . . . . . 87.0% 88.1% 85.3%
The decrease in the fresh dough and other product cost of sales to franchisees in fiscal 2013 as a percentage of fresh dough and
other product sales to franchisees was primarily the result of the year-over-year decrease in ingredient costs and improved leverage
from new bakery-cafes and higher comparable net bakery-cafe sales.