Panera Bread 2013 Annual Report Download - page 72
Download and view the complete annual report
Please find page 72 of the 2013 Panera Bread annual report below. You can navigate through the pages in the report by either clicking on the pages listed below, or by using the keyword search tool below to find specific information within the annual report.-
 1
1 -
2
-
3
-
4
-
5
-
6
-
7
-
8
-
9
-
10
-
11
-
12
-
13
-
14
-
15
-
16
-
17
-
18
-
19
-
20
-
21
-
22
-
23
-
24
-
25
-
26
-
27
-
28
-
29
-
30
-
31
-
32
-
33
-
34
-
35
-
36
-
37
-
38
-
39
-
40
-
41
-
42
-
43
-
44
-
45
-
46
-
47
-
48
-
49
-
50
-
51
-
52
-
53
-
54
-
55
-
56
-
57
-
58
-
59
-
60
-
61
-
 62
62 -
 63
63 -
 64
64 -
 65
65 -
 66
66 -
 67
67 -
 68
68 -
 69
69 -
 70
70 -
 71
71 -
 72
72 -
 73
73 -
 74
74 -
 75
75 -
 76
76 -
 77
77 -
 78
78 -
 79
79 -
 80
80 -
 81
81 -
 82
82 -
83
-
84
-
85
-
86
-
87
-
88
 |
 |

PANERA BREAD COMPANY
NOTES TO THE CONSOLIDATED FINANCIAL STATEMENTS (continued)
64
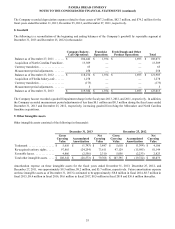
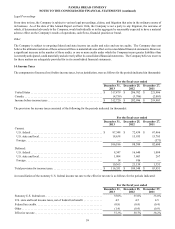
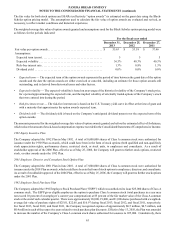
The following table summarizes the Company’s stock option activity under its stock-based compensation plans during fiscal 2013:
Shares
(in
thousands)
Weighted
Average
Exercise
Price
Weighted
Average
Contractual
Ter m
Remaining
(Years)
Aggregate
Intrinsic
Value (1)
(in
thousands)
Outstanding at December 25, 2012 . . . . . . . . . . . . . . . . . . . 46 $ 59.94
Granted . . . . . . . . . . . . . . . . . . . . . . . . . . . . . . . . . . . . . . . 3 156.30
Exercised. . . . . . . . . . . . . . . . . . . . . . . . . . . . . . . . . . . . . . (13) 45.38 1,649
Cancelled. . . . . . . . . . . . . . . . . . . . . . . . . . . . . . . . . . . . . . — —
Outstanding at December 31, 2013 . . . . . . . . . . . . . . . . . . . 36 $ 71.93 1.6 3,736
Exercisable at December 31, 2013 . . . . . . . . . . . . . . . . . . . 36 $ 71.93 1.6 $ 3,736
(1) Intrinsic value for activities other than exercises is defined as the difference between the grant price and the market value on
the last day of fiscal 2013 of $176.69 for those stock options where the market value is greater than the exercise price. For
exercises, intrinsic value is defined as the difference between the grant price and the market value on the date of exercise.
Cash received from the exercise of stock options in fiscal 2013, fiscal 2012, and fiscal 2011 was $0.6 million, $4.5 million, and
$3.2 million respectively. Windfall tax benefits realized from exercised stock options in fiscal 2013, fiscal 2012, and fiscal 2011
were $8.1 million, $8.6 million, and $5.0 million, respectively, and were included as cash flows from financing activities in the
Consolidated Statements of Cash Flows.
A SSAR is an award that allows the recipient to receive common stock equal to the appreciation in the fair market value of the
Company’s Class A common stock between the date the award was granted and the conversion date for the number of shares
vested. SSARs under the 2005 LTIP are granted with an exercise price equal to the quoted market value of the Company’s common
stock on the date of grant. In addition, SSARs generally vest 25 percent after two years from the date of grant and thereafter 25
percent each year for the next three years and have a six-year term. As of December 31, 2013, the total unrecognized compensation
cost related to non-vested SSARs was $0.9 million, which is net of a $0.3 million forfeiture estimate, and is expected to be
recognized over a weighted-average period of approximately 4.2 years. The Company uses historical data to estimate pre-vesting
forfeiture rates. For fiscal 2013, 2012, and 2011, stock-based compensation expense related to SSARs was $0.2 million, $0.1
million, and $0.1 million, respectively, and was charged to general and administrative expenses in the Consolidated Statements
of Comprehensive Income.
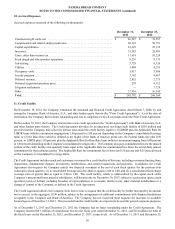
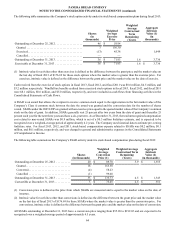
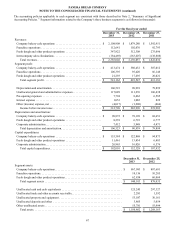
The following table summarizes the Company’s SSAR activity under its stock-based compensation plan during fiscal 2013:
Shares
(in thousands)
Weighted
Average
Conversion
Price (1)
Weighted Average
Contractual Term
Remaining
(Years)
Aggregate
Intrinsic
Value (2)
(in thousands)
Outstanding at December 25, 2012 . . . . . . . . . . 20 $ 89.70 3.9 $ 1,355
Granted . . . . . . . . . . . . . . . . . . . . . . . . . . . . . . . 18 165.58
Converted . . . . . . . . . . . . . . . . . . . . . . . . . . . . . (4) 58.23
Cancelled . . . . . . . . . . . . . . . . . . . . . . . . . . . . . (1) 99.60
Outstanding at December 31, 2013 . . . . . . . . . . 33 $ 135.73 4.5 $ 1,343
Convertible at December 31, 2013 . . . . . . . . . . . 3 $ 75.65 2.5 $ 351
(1) Conversion price is defined as the price from which SSARs are measured and is equal to the market value on the date of
issuance.
(2) Intrinsic value for activities other than conversions is defined as the difference between the grant price and the market value
on the last day of fiscal 2013 of $176.69 for those SSARs where the market value is greater than the conversion price. For
conversions, intrinsic value is defined as the difference between the grant price and the market value on the date of conversion.
All SSARs outstanding at December 31, 2013 have a conversion price ranging from $55.20 to $192.65 and are expected to be
recognized over a weighted-average period of approximately 4.5 years.