Panera Bread 2013 Annual Report Download - page 39
Download and view the complete annual report
Please find page 39 of the 2013 Panera Bread annual report below. You can navigate through the pages in the report by either clicking on the pages listed below, or by using the keyword search tool below to find specific information within the annual report.-
 1
1 -
2
-
3
-
4
-
5
-
6
-
7
-
8
-
9
-
10
-
11
-
12
-
13
-
14
-
15
-
16
-
17
-
18
-
19
-
20
-
21
-
22
-
23
-
24
-
25
-
26
-
27
-
28
-
 29
29 -
 30
30 -
 31
31 -
 32
32 -
 33
33 -
 34
34 -
 35
35 -
 36
36 -
 37
37 -
 38
38 -
 39
39 -
 40
40 -
 41
41 -
 42
42 -
 43
43 -
 44
44 -
 45
45 -
 46
46 -
 47
47 -
 48
48 -
 49
49 -
50
-
51
-
52
-
53
-
54
-
55
-
56
-
57
-
58
-
59
-
60
-
61
-
62
-
63
-
64
-
65
-
66
-
67
-
68
-
69
-
70
-
71
-
72
-
73
-
74
-
75
-
76
-
77
-
78
-
79
-
80
-
81
-
82
-
83
-
84
-
85
-
86
-
87
-
88
 |
 |

31
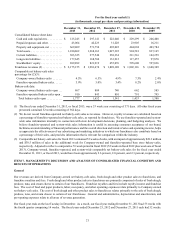
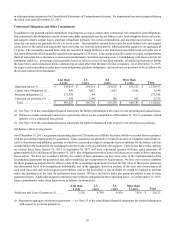
Capital Expenditures
Capital expenditures are the largest ongoing component of our investing activities and include expenditures for new bakery-cafes
and fresh dough facilities, improvements to existing bakery-cafes and fresh dough facilities, and other capital needs, which include
investments in technology infrastructure to support ongoing strategic initiatives. A summary of capital expenditures for the periods
indicated consisted of the following (in thousands):
For the fiscal year ended
December 31,
2013
December 25,
2012
December 27,
2011
New bakery-cafe and fresh dough facilities. . . . . . . . . . . . . . . . . . . $ 91,590 $ 81,758 $ 63,021
Bakery-cafe and fresh dough facility improvements . . . . . . . . . . . . 62,607 42,644 30,858
Other capital needs . . . . . . . . . . . . . . . . . . . . . . . . . . . . . . . . . . . . . . 37,813 27,926 14,053
Total . . . . . . . . . . . . . . . . . . . . . . . . . . . . . . . . . . . . . . . . . . . . . . . . $ 192,010 $ 152,328 $ 107,932
Our capital requirements, including development costs related to the opening or acquisition of additional bakery-cafes and fresh
dough facilities, maintenance and remodel expenditures, and investments in technology infrastructure, have been and will continue
to be significant. Our future capital requirements and the adequacy of available funds will depend on many factors, including the
pace of expansion, real estate markets, site locations, and the nature of the arrangements negotiated with landlords. We believe
that cash provided by our operations and available borrowings under our credit facility will be sufficient to fund our capital
requirements in both our short-term and long-term future. We currently anticipate $225 million to $250 million of capital
expenditures in fiscal 2014.
Business Combinations
We used approximately $2.4 million, $48.0 million, and $44.4 million of cash flows for acquisitions, in fiscal 2013, 2012, and
2011, respectively. In fiscal 2013, we acquired substantially all the assets of one bakery-cafe from a Florida franchisee. In fiscal
2012, we acquired substantially all the assets and certain liabilities of 16 bakery-cafes from our North Carolina franchisee. In
fiscal 2011, we acquired substantially all the assets and certain liabilities of 25 bakery-cafes from our Milwaukee franchisee and
an additional five bakery-cafes from our Indiana franchisee. As of December 31, 2013 and December 25, 2012, $0.3 million and
$4.1 million, respectively, were included within our Consolidated Balance Sheets for contingent or accrued purchase price
remaining from previously completed acquisitions. See Note 3 to the consolidated financial statements for further information
with respect to our acquisition activity in fiscal 2013, fiscal 2012, and fiscal 2011.
Financing Activities
Cash used in financing activities was $332.0 million, $19.2 million, and $91.4 million in fiscal 2013, fiscal 2012, and fiscal 2011,
respectively. Financing activities in fiscal 2013 consisted primarily of $339.4 million used to repurchase shares of our Class A
common stock and $4.1 million for the payment of deferred acquisition holdbacks, partially offset by $8.1 million received from
the tax benefit from exercise of stock options. Financing activities in fiscal 2012 consisted primarily of $31.6 million used to
repurchase shares of our Class A common stock, partially offset by $8.6 million received from the tax benefit from exercise of
stock options. Financing activities in fiscal 2011 consisted primarily of $96.6 million used to repurchase shares of our Class A
common stock and $5.0 million for the payment of deferred acquisition holdbacks, partially offset by $5.0 million received from
the tax benefit from exercise of stock options.
Share Repurchases
On November 17, 2009, our Board of Directors approved a three year share repurchase authorization of up to $600 million of our
Class A common stock, pursuant to which we repurchased shares on the open market under a Rule 10b5-1 plan, which we refer
to as the 2009 repurchase authorization. During fiscal 2012, we repurchased 34,600 shares under the 2009 repurchase authorization,
at an average price of $144.24 per share, for an aggregate purchase price of $5.0 million. During fiscal 2011, we repurchased
877,100 shares under the 2009 repurchase authorization, at an average price of $103.55 per share, for an aggregate purchase price
of $90.8 million. On August 23, 2012, our Board of Directors terminated the 2009 repurchase authorization. Prior to its termination,
we had repurchased an aggregate of 2,844,669 shares of our Class A common stock under the 2009 repurchase authorization, at
a weighted-average price of $87.03 per share, for an aggregate purchase price of approximately $247.6 million.