Panera Bread 2013 Annual Report Download - page 75
Download and view the complete annual report
Please find page 75 of the 2013 Panera Bread annual report below. You can navigate through the pages in the report by either clicking on the pages listed below, or by using the keyword search tool below to find specific information within the annual report.-
 1
1 -
2
-
3
-
4
-
5
-
6
-
7
-
8
-
9
-
10
-
11
-
12
-
13
-
14
-
15
-
16
-
17
-
18
-
19
-
20
-
21
-
22
-
23
-
24
-
25
-
26
-
27
-
28
-
29
-
30
-
31
-
32
-
33
-
34
-
35
-
36
-
37
-
38
-
39
-
40
-
41
-
42
-
43
-
44
-
45
-
46
-
47
-
48
-
49
-
50
-
51
-
52
-
53
-
54
-
55
-
56
-
57
-
58
-
59
-
60
-
61
-
62
-
63
-
64
-
 65
65 -
 66
66 -
 67
67 -
 68
68 -
 69
69 -
 70
70 -
 71
71 -
 72
72 -
 73
73 -
 74
74 -
 75
75 -
 76
76 -
 77
77 -
 78
78 -
 79
79 -
 80
80 -
 81
81 -
 82
82 -
 83
83 -
 84
84 -
 85
85 -
86
-
87
-
88
 |
 |

PANERA BREAD COMPANY
NOTES TO THE CONSOLIDATED FINANCIAL STATEMENTS (continued)
67
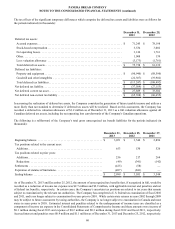
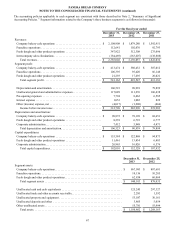
The accounting policies applicable to each segment are consistent with those described in Note 2, “Summary of Significant
Accounting Policies.” Segment information related to the Company’s three business segments is as follows (in thousands):
For the fiscal year ended
December 31,
2013
December 25,
2012
December 27,
2011
Revenues:
Company bakery-cafe operations . . . . . . . . . . . . . . . . . . . . . . . . . . . . . . . . $ 2,108,908 $ 1,879,280 $ 1,592,951
Franchise operations . . . . . . . . . . . . . . . . . . . . . . . . . . . . . . . . . . . . . . . . . . 112,641 102,076 92,793
Fresh dough and other product operations . . . . . . . . . . . . . . . . . . . . . . . . . 347,922 312,308 275,096
Intercompany sales eliminations . . . . . . . . . . . . . . . . . . . . . . . . . . . . . . . . . (184,469)(163,607)(138,808)
Total revenues. . . . . . . . . . . . . . . . . . . . . . . . . . . . . . . . . . . . . . . . . . . . . $ 2,385,002 $ 2,130,057 $ 1,822,032
Segment profit:
Company bakery-cafe operations . . . . . . . . . . . . . . . . . . . . . . . . . . . . . . . . $ 413,474 $ 380,432 $ 307,012
Franchise operations . . . . . . . . . . . . . . . . . . . . . . . . . . . . . . . . . . . . . . . . . . 106,395 95,420 86,148
Fresh dough and other product operations . . . . . . . . . . . . . . . . . . . . . . . . . 21,293 17,695 20,021
Total segment profit . . . . . . . . . . . . . . . . . . . . . . . . . . . . . . . . . . . . . . . . $ 541,162 $ 493,547 $ 413,181
Depreciation and amortization . . . . . . . . . . . . . . . . . . . . . . . . . . . . . . . . . . 106,523 90,939 79,899
Unallocated general and administrative expenses. . . . . . . . . . . . . . . . . . . . 117,089 111,276 106,438
Pre-opening expenses . . . . . . . . . . . . . . . . . . . . . . . . . . . . . . . . . . . . . . . . . 7,794 8,462 6,585
Interest expense . . . . . . . . . . . . . . . . . . . . . . . . . . . . . . . . . . . . . . . . . . . . . . 1,053 1,082 822
Other (income) expense, net . . . . . . . . . . . . . . . . . . . . . . . . . . . . . . . . . . . . (4,017)(1,208)(466)
Income before income taxes . . . . . . . . . . . . . . . . . . . . . . . . . . . . . . . . . . $ 312,720 $ 282,996 $ 219,903
Depreciation and amortization:
Company bakery-cafe operations . . . . . . . . . . . . . . . . . . . . . . . . . . . . . . . . $ 90,872 $ 78,198 $ 68,651
Fresh dough and other product operations . . . . . . . . . . . . . . . . . . . . . . . . . 8,239 6,793 6,777
Corporate administration . . . . . . . . . . . . . . . . . . . . . . . . . . . . . . . . . . . . . . . 7,412 5,948 4,471
Total depreciation and amortization . . . . . . . . . . . . . . . . . . . . . . . . . . . . $ 106,523 $ 90,939 $ 79,899
Capital expenditures:
Company bakery-cafe operations . . . . . . . . . . . . . . . . . . . . . . . . . . . . . . . . $ 153,584 $ 122,868 $ 94,873
Fresh dough and other product operations . . . . . . . . . . . . . . . . . . . . . . . . . 11,461 13,434 6,483
Corporate administration . . . . . . . . . . . . . . . . . . . . . . . . . . . . . . . . . . . . . . . 26,965 16,026 6,576
Total capital expenditures. . . . . . . . . . . . . . . . . . . . . . . . . . . . . . . . . . . . $ 192,010 $ 152,328 $ 107,932
December 31,
2013
December 25,
2012
Segment assets:
Company bakery-cafe operations. . . . . . . . . . . . . . . . . . . . . . . . . . . . . . . . . . . . . . . . . . . . . . . $ 867,093 $ 807,681
Franchise operations. . . . . . . . . . . . . . . . . . . . . . . . . . . . . . . . . . . . . . . . . . . . . . . . . . . . . . . . . 10,156 10,285
Fresh dough and other product operations . . . . . . . . . . . . . . . . . . . . . . . . . . . . . . . . . . . . . . . . 62,854 60,069
Total segment assets . . . . . . . . . . . . . . . . . . . . . . . . . . . . . . . . . . . . . . . . . . . . . . . . . . . . . . $ 940,103 $ 878,035
Unallocated cash and cash equivalents . . . . . . . . . . . . . . . . . . . . . . . . . . . . . . . . . . . . . . . . . . 125,245 297,327
Unallocated trade and other accounts receivable . . . . . . . . . . . . . . . . . . . . . . . . . . . . . . . . . . . 2,281 1,592
Unallocated property and equipment . . . . . . . . . . . . . . . . . . . . . . . . . . . . . . . . . . . . . . . . . . . . 53,587 30,161
Unallocated deposits and other . . . . . . . . . . . . . . . . . . . . . . . . . . . . . . . . . . . . . . . . . . . . . . . . 3,865 5,054
Other unallocated assets . . . . . . . . . . . . . . . . . . . . . . . . . . . . . . . . . . . . . . . . . . . . . . . . . . . . . . 55,781 55,994
Total assets. . . . . . . . . . . . . . . . . . . . . . . . . . . . . . . . . . . . . . . . . . . . . . . . . . . . . . . . . . . . . . $ 1,180,862 $ 1,268,163