Panera Bread 2013 Annual Report Download - page 62
Download and view the complete annual report
Please find page 62 of the 2013 Panera Bread annual report below. You can navigate through the pages in the report by either clicking on the pages listed below, or by using the keyword search tool below to find specific information within the annual report.-
 1
1 -
2
-
3
-
4
-
5
-
6
-
7
-
8
-
9
-
10
-
11
-
12
-
13
-
14
-
15
-
16
-
17
-
18
-
19
-
20
-
21
-
22
-
23
-
24
-
25
-
26
-
27
-
28
-
29
-
30
-
31
-
32
-
33
-
34
-
35
-
36
-
37
-
38
-
39
-
40
-
41
-
42
-
43
-
44
-
45
-
46
-
47
-
48
-
49
-
50
-
51
-
 52
52 -
 53
53 -
 54
54 -
 55
55 -
 56
56 -
 57
57 -
 58
58 -
 59
59 -
 60
60 -
 61
61 -
 62
62 -
 63
63 -
 64
64 -
 65
65 -
 66
66 -
 67
67 -
 68
68 -
 69
69 -
 70
70 -
 71
71 -
 72
72 -
73
-
74
-
75
-
76
-
77
-
78
-
79
-
80
-
81
-
82
-
83
-
84
-
85
-
86
-
87
-
88
 |
 |

PANERA BREAD COMPANY
NOTES TO THE CONSOLIDATED FINANCIAL STATEMENTS (continued)
54
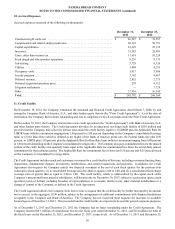
Texas Divestiture
On February 9, 2011, the Company sold substantially all of the assets of two Paradise bakery-cafes to an existing Texas franchisee
for a sale price of approximately $0.1 million, resulting in a nominal gain, which was classified in other (income) expense, net in
the Consolidated Statements of Comprehensive Income.
Accrued Purchase Price Payments
During the fiscal years ended December 31, 2013, December 25, 2012, and December 27, 2011, the Company paid approximately
$4.1 million, $2.1 million, and $5.0 million, respectively, including accrued interest, of previously accrued acquisition purchase
price in accordance with the asset purchase agreements. There was $0.3 million and $4.1 million of accrued purchase price
remaining as of December 31, 2013 and December 25, 2012, respectively.
4. Investments Held to Maturity
During the fiscal year ended December 31, 2013, the Company purchased and sold seven zero-coupon discount notes that were
classified as held-to-maturity. The amortized cost of the investments sold was $97.9 million. The Company realized a loss on
the sale of less than $0.1 million. The Company sold the investments prior to maturity during the fiscal year ended December 31,
2013 as a result of higher than anticipated liquidity needs.
5. Fair Value Measurements
The Company’s $18.1 million and $99.4 million in cash equivalents at December 31, 2013 and December 25, 2012 were carried
at fair value in the Consolidated Balance Sheets based on quoted market prices for identical securities (Level 1 inputs).
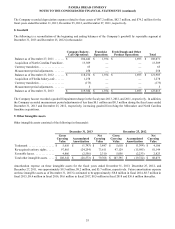
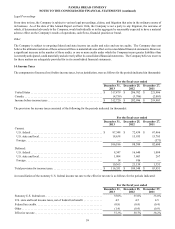
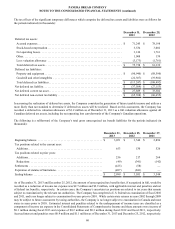
6. Inventories
Inventories consisted of the following (in thousands):
December 31,
2013
December 25,
2012
Food:
Fresh dough facilities:
Raw materials . . . . . . . . . . . . . . . . . . . . . . . . . . . . . . . . . . . . . . . . . . . . . . . . . . . . . . . . . . . $ 3,377 $ 3,418
Finished goods. . . . . . . . . . . . . . . . . . . . . . . . . . . . . . . . . . . . . . . . . . . . . . . . . . . . . . . . . . . 545 420
Bakery-cafes:
Raw materials . . . . . . . . . . . . . . . . . . . . . . . . . . . . . . . . . . . . . . . . . . . . . . . . . . . . . . . . . . . 14,329 12,727
Paper goods. . . . . . . . . . . . . . . . . . . . . . . . . . . . . . . . . . . . . . . . . . . . . . . . . . . . . . . . . . . . . . . . . 3,665 3,149
Total . . . . . . . . . . . . . . . . . . . . . . . . . . . . . . . . . . . . . . . . . . . . . . . . . . . . . . . . . . . . . . . . . . . . . . $ 21,916 $ 19,714
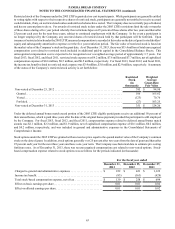
7. Property and Equipment, net
Major classes of property and equipment consisted of the following (in thousands):
December 31,
2013
December 25,
2012
Leasehold improvements . . . . . . . . . . . . . . . . . . . . . . . . . . . . . . . . . . . . . . . . . . . . . . . . . . . . . . $ 607,472 $ 542,081
Machinery and equipment . . . . . . . . . . . . . . . . . . . . . . . . . . . . . . . . . . . . . . . . . . . . . . . . . . . . . 305,060 265,350
Furniture and fixtures . . . . . . . . . . . . . . . . . . . . . . . . . . . . . . . . . . . . . . . . . . . . . . . . . . . . . . . . . 149,445 130,044
Computer hardware and software. . . . . . . . . . . . . . . . . . . . . . . . . . . . . . . . . . . . . . . . . . . . . . . . 87,316 63,701
Construction in progress . . . . . . . . . . . . . . . . . . . . . . . . . . . . . . . . . . . . . . . . . . . . . . . . . . . . . . . 80,108 53,189
Smallwares . . . . . . . . . . . . . . . . . . . . . . . . . . . . . . . . . . . . . . . . . . . . . . . . . . . . . . . . . . . . . . . . . 27,031 25,152
Land . . . . . . . . . . . . . . . . . . . . . . . . . . . . . . . . . . . . . . . . . . . . . . . . . . . . . . . . . . . . . . . . . . . . . . 2,856 2,201
1,259,288 1,081,718
Less: accumulated depreciation . . . . . . . . . . . . . . . . . . . . . . . . . . . . . . . . . . . . . . . . . . . . . . . . . (589,879)(509,964)
Property and equipment, net . . . . . . . . . . . . . . . . . . . . . . . . . . . . . . . . . . . . . . . . . . . . . . . . . . . . $ 669,409 $ 571,754