Panera Bread 2013 Annual Report Download - page 34
Download and view the complete annual report
Please find page 34 of the 2013 Panera Bread annual report below. You can navigate through the pages in the report by either clicking on the pages listed below, or by using the keyword search tool below to find specific information within the annual report.-
 1
1 -
2
-
3
-
4
-
5
-
6
-
7
-
8
-
9
-
10
-
11
-
12
-
13
-
14
-
15
-
16
-
17
-
18
-
19
-
20
-
21
-
22
-
23
-
 24
24 -
 25
25 -
 26
26 -
 27
27 -
 28
28 -
 29
29 -
 30
30 -
 31
31 -
 32
32 -
 33
33 -
 34
34 -
 35
35 -
 36
36 -
 37
37 -
 38
38 -
 39
39 -
 40
40 -
 41
41 -
 42
42 -
 43
43 -
 44
44 -
45
-
46
-
47
-
48
-
49
-
50
-
51
-
52
-
53
-
54
-
55
-
56
-
57
-
58
-
59
-
60
-
61
-
62
-
63
-
64
-
65
-
66
-
67
-
68
-
69
-
70
-
71
-
72
-
73
-
74
-
75
-
76
-
77
-
78
-
79
-
80
-
81
-
82
-
83
-
84
-
85
-
86
-
87
-
88
 |
 |

26
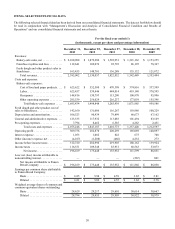
Bakery-cafe sales, net
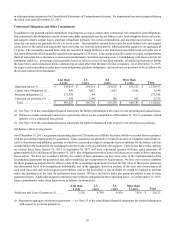
The following table summarizes net bakery-cafe sales for the periods indicated (dollars in thousands):
For the fiscal year ended
December 31,
2013
December 25,
2012
December 27,
2011
% Change
in 2013
% Change
in 2012
Bakery-cafe sales, net . . . . . . . . . . . . . . . . . . . $ 2,108,908 $ 1,879,280 $ 1,592,951 12.2% 18.0%
As a percentage of total revenue . . . . . . . . . . . 88.4% 88.2% 87.4%
Company-owned average weekly net sales. . . $ 47,741 $ 46,836 $ 44,071 1.9% 6.3%
Company-owned number of operating weeks 44,173 40,125 36,140 10.1% 11.0%
The increase in net bakery-cafe sales in fiscal 2013 compared to the prior fiscal year was primarily due to the opening of 63 new
Company-owned bakery-cafes, the impact of the additional week in fiscal 2013, which contributed net bakery-cafe sales of
approximately $29.8 million, and the 2.6 percent increase in comparable Company-owned net bakery-cafe sales in fiscal 2013,
which reflects a comparative 53 week period in fiscal 2012, partially offset by the closure of six Company-owned bakery-cafes.
The increase in net bakery-cafe sales in fiscal 2012 compared to the prior fiscal year was primarily due to the opening of 59 new
Company-owned bakery-cafes, the acquisition of 16 franchise-operated bakery-cafes, and the 6.5 percent increase in comparable
Company-owned net bakery-cafe sales in fiscal 2012, partially offset by the closure of six Company-owned bakery-cafes.
The increase in average weekly net sales for Company-owned bakery-cafes in fiscal 2013 compared to the prior fiscal year was
primarily due to average check growth that resulted from retail price increases and our category management initiatives.
The increase in average weekly net sales for Company-owned bakery-cafes in fiscal 2012 compared to the prior fiscal year was
primarily due to the above noted average check growth that resulted from retail price increases and our category management
initiatives.
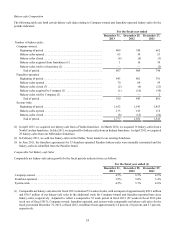
Franchise royalties and fees
The following table summarizes franchise royalties and fees for the periods indicated (dollars in thousands):
For the fiscal year ended
December 31,
2013
December 25,
2012
December 27,
2011
% Change
in 2013
% Change
in 2012
Franchise royalties . . . . . . . . . . . . . . . . . . . . . $ 110,461 $ 100,159 $ 90,486 10.3% 10.7 %
Franchise fees . . . . . . . . . . . . . . . . . . . . . . . . . 2,180 1,917 2,307 13.7% (16.9)%
Total . . . . . . . . . . . . . . . . . . . . . . . . . . . . . . $ 112,641 $ 102,076 $ 92,793 10.4% 10.0 %
Franchise-operated average weekly net sales .$ 47,079 $ 46,526 $ 44,527 1.2% 4.5 %
Franchise-operated number of operating
weeks. . . . . . . . . . . . . . . . . . . . . . . . . . . . . . . . 46,202 42,593 41,058 8.5% 3.7 %
The increase in franchise royalty and fee revenues in fiscal 2013 compared to the prior fiscal year was primarily due to the opening
of 70 new franchise-operated bakery-cafes, the impact of the additional week in fiscal 2013, which contributed franchise royalties
and fees of approximately $2.4 million, and the 2.0 percent increase in comparable franchise-operated net bakery-cafe sales in
fiscal 2013, which reflects a comparative 53 week period in fiscal 2012.
The increase in franchise royalty and fee revenues in fiscal 2012 compared to the prior fiscal year was primarily due to the opening
of 64 new franchise-operated bakery-cafes and the 5.0 percent increase in comparable franchise-operated net bakery-cafe sales in
fiscal 2012, partially offset by our acquisition of 16 franchise-operated bakery-cafes and the closure of six franchise-operated
bakery-cafes.
As of December 31, 2013, there were 910 franchise-operated bakery-cafes open and we have received commitments to open 117
additional franchise-operated bakery-cafes. The timetables for opening these bakery-cafes are established in their respective Area