Panera Bread 2013 Annual Report Download - page 30
Download and view the complete annual report
Please find page 30 of the 2013 Panera Bread annual report below. You can navigate through the pages in the report by either clicking on the pages listed below, or by using the keyword search tool below to find specific information within the annual report.-
 1
1 -
2
-
3
-
4
-
5
-
6
-
7
-
8
-
9
-
10
-
11
-
12
-
13
-
14
-
15
-
16
-
17
-
18
-
19
-
 20
20 -
 21
21 -
 22
22 -
 23
23 -
 24
24 -
 25
25 -
 26
26 -
 27
27 -
 28
28 -
 29
29 -
 30
30 -
 31
31 -
 32
32 -
 33
33 -
 34
34 -
 35
35 -
 36
36 -
 37
37 -
 38
38 -
 39
39 -
 40
40 -
41
-
42
-
43
-
44
-
45
-
46
-
47
-
48
-
49
-
50
-
51
-
52
-
53
-
54
-
55
-
56
-
57
-
58
-
59
-
60
-
61
-
62
-
63
-
64
-
65
-
66
-
67
-
68
-
69
-
70
-
71
-
72
-
73
-
74
-
75
-
76
-
77
-
78
-
79
-
80
-
81
-
82
-
83
-
84
-
85
-
86
-
87
-
88
 |
 |
22
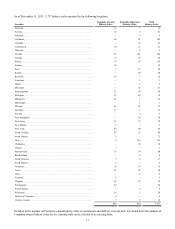
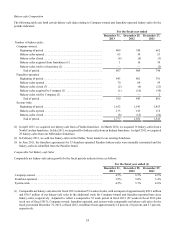
We include in this report information on Company-owned, franchise-operated, and system-wide comparable net bakery-cafe sales
percentages. Bakery-cafes in our comparable net bakery-cafe sales percentages include those bakery-cafes with an open date prior
to the first day of our prior fiscal year, which we refer to as our base store bakery-cafes. Company-owned comparable net bakery-
cafe sales percentages are based on net sales from Company-owned base store bakery-cafes. Franchise-operated comparable net
bakery-cafe sales percentages are based on net sales from franchise-operated base store bakery-cafes, as reported by franchisees.
System-wide comparable net bakery-cafe sales percentages are based on net sales at Company-owned and franchise-operated base
store bakery-cafes. Acquired Company-owned and franchise-operated bakery-cafes and other restaurant or bakery-cafe concepts
are included in our comparable net bakery-cafe sales percentages only if we or our franchisee previously held or acquired a
100 percent ownership interest prior to the first day of our prior fiscal year. Comparable net bakery-cafe sales exclude closed
locations.
We do not record franchise-operated net bakery-cafe sales as revenues. However, royalty revenues are calculated based on a
percentage of franchise-operated net bakery-cafe sales, as reported by franchisees. We use franchise-operated and system-wide
sales information internally in connection with store development decisions, planning, and budgeting analyses. We believe
franchise-operated and system-wide sales information is useful in assessing consumer acceptance of our brand, facilitates an
understanding of our financial performance and the overall direction and trends of sales and operating income, helps us appreciate
the effectiveness of our advertising and marketing initiatives, to which our franchisees also contribute based on a percentage of
their net sales, and provides information that is relevant for comparison within the industry.
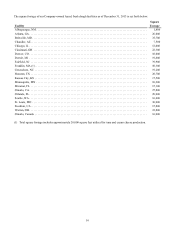
We also include in this report information on Company-owned, franchise-operated, and system-wide average weekly net sales.
Average weekly net sales are calculated by dividing total net sales in the period by operating weeks in the fiscal period. Accordingly,
year-over-year results reflect sales for all locations, whereas comparable net bakery-cafe sales exclude closed locations and are
based on sales only from our base store bakery-cafes. New stores typically experience an opening “honeymoon” period during
which they generate higher average weekly net sales in the first 12 to 16 weeks after opening, after which customers “settle-in”
to normal usage patterns. On average, average weekly net sales during the “settle-in” period are five percent to 10 percent less
than during the “honeymoon” period. As a result, year-over-year results of average weekly net sales are generally lower than the
results in comparable net bakery-cafe sales. This results from the relationship of the number of bakery-cafes in the “honeymoon”
period, the number of bakery-cafes in the “settle-in” period, and the number of bakery-cafes in the comparable bakery-cafe base.
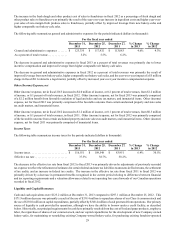
Executive Summary of Results
In fiscal 2013, we earned $6.81 per diluted share with the following performance on key metrics: system-wide comparable net
bakery-cafe sales growth of 4.2 percent (growth of 4.5 percent for Company-owned bakery-cafes and growth of 3.9 percent for
franchise-operated bakery-cafes), which included the impact of the additional week in fiscal 2013, a 53 week year; system-wide
average weekly net sales increased 1.6 percent to $47,403 ($47,741 for Company-owned bakery-cafes and $47,079 for franchise-
operated bakery-cafes); 133 new bakery-cafes opened system-wide (63 Company-owned bakery-cafes and 70 franchise-operated
bakery-cafes); and eight bakery-cafes closed system-wide (six Company-owned bakery-cafes and two franchise-operated bakery-
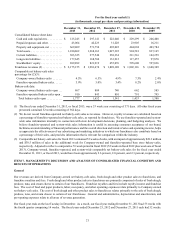
cafes). Our fiscal 2013 earnings of $6.81 per diluted share included a favorable impact of $0.14 per diluted share from the
repurchase in fiscal 2013 of 1,992,250 shares under our share repurchase authorization we approved in 2012, or our 2012 share
repurchase authorization, a favorable impact of $0.13 per diluted share for adjustments recorded in the fiscal quarter ended
September 24, 2013 to previously recorded tax expense to reflect the refinement of estimates of certain state tax attributes to
amounts in filed returns and the settlement of tax audits, and approximately $0.13 of earnings per diluted share for the additional
week in fiscal 2013.
In the fiscal quarter ended December 31, 2013, we earned $1.96 per diluted share with the following performance on key metrics:
system-wide comparable net bakery-cafe sales growth of 8.1 percent (growth of 8.7 percent for Company-owned bakery-cafes
and growth of 7.5 percent for franchise-operated bakery-cafes), which included the impact of the additional week in the fiscal
quarter ended December 31, 2013, a 14 week quarter; system-wide average weekly net sales decreased 0.5 percent to $48,340
($48,781 for Company-owned bakery-cafes and $47,919 for franchise-operated bakery-cafes); 42 new bakery-cafes opened system-
wide (18 Company-owned bakery-cafes and 24 franchise-operated bakery-cafes); and one Company-owned bakery-cafe closed.
Our fiscal quarter ended December 31, 2013 earnings of $1.96 per diluted share included approximately $0.13 of earnings per
diluted share for the additional week in fiscal 2013 and a favorable impact of $0.04 per diluted share from the repurchase of
847,364 shares under our 2012 share repurchase authorization in the fiscal quarter ended December 31, 2013.
In fiscal 2012, we earned $5.89 per diluted share with the following performance on key metrics: system-wide comparable net
bakery-cafe sales growth of 5.7 percent (growth of 6.5 percent for Company-owned bakery-cafes and growth of 5.0 percent for
franchise-operated bakery-cafes); system-wide average weekly net sales increased 5.3 percent to $46,676 ($46,836 for Company-
owned bakery-cafes and $46,526 for franchise-operated bakery-cafes); 123 new bakery-cafes opened system-wide (59 Company-
owned bakery-cafes and 64 franchise-operated bakery-cafes); and 12 bakery-cafes closed system-wide (six Company-owned
bakery-cafes and six franchise-operated bakery-cafes). Our fiscal 2012 earnings of $5.89 per diluted share included a favorable