NetFlix 2015 Annual Report Download - page 71
Download and view the complete annual report
Please find page 71 of the 2015 NetFlix annual report below. You can navigate through the pages in the report by either clicking on the pages listed below, or by using the keyword search tool below to find specific information within the annual report.-
 1
1 -
2
-
3
-
4
-
5
-
6
-
7
-
8
-
9
-
10
-
11
-
12
-
13
-
14
-
15
-
16
-
17
-
18
-
19
-
20
-
21
-
22
-
23
-
24
-
25
-
26
-
27
-
28
-
29
-
30
-
31
-
32
-
33
-
34
-
35
-
36
-
37
-
38
-
39
-
40
-
41
-
42
-
43
-
44
-
45
-
46
-
47
-
48
-
49
-
50
-
51
-
52
-
53
-
54
-
55
-
56
-
57
-
58
-
59
-
60
-
 61
61 -
 62
62 -
 63
63 -
 64
64 -
 65
65 -
 66
66 -
 67
67 -
 68
68 -
 69
69 -
 70
70 -
 71
71 -
 72
72 -
 73
73 -
 74
74 -
 75
75 -
 76
76 -
 77
77 -
 78
78 -
 79
79 -
 80
80
 |
 |

(“CODM”) reviews the operating results in assessing performance and allocating resources. The Company’s
CODM reviews revenue and contribution profit (loss) for each of the reportable segments. Contribution profit
(loss) is defined as revenues less cost of revenues and marketing expenses incurred by the segment. The
Company has aggregated the results of the International operating segments into one reportable segment because
these operating segments share similar long-term economic and other qualitative characteristics.
The Domestic streaming segment derives revenues from monthly membership fees for services consisting
solely of streaming content to the members in the United States. The International streaming segment derives
revenues from monthly membership fees for services consisting solely of streaming content to members outside
of the United States. The Domestic DVD segment derives revenues from monthly membership fees for services
consisting solely of DVD-by-mail. Revenues and the related payment card fees are attributed to the operating
segment based on the nature of the underlying membership (streaming or DVD) and the geographic region from
which the membership originates. There are no internal revenue transactions between the Company’s segments.
The majority of cost of revenues relate to content expenses directly incurred by the segment. However, in
connection with global expansion, content acquired, licensed, and produced increasingly includes global rights.
The Company allocates this content between the International and Domestic streaming segments based on
estimated fair market value. Other costs of revenues such as delivery costs are primarily attributed to the
operating segment based on amounts directly incurred by the segment. Marketing expenses consist primarily of
advertising expenses and payments made to our affiliates and device partners which are generally included in the
segment in which the expenditures are directly incurred.
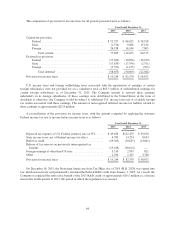
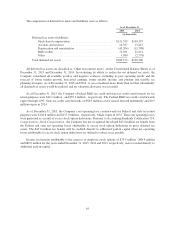
The Company’s long-lived tangible assets were located as follows:
As of December 31,
2015 2014
(in thousands)
United States ................................................... $159,566 $138,704
International ................................................... 13,846 11,171
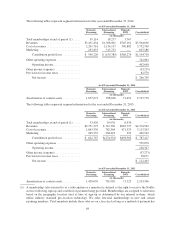
The following tables represent segment information for the year ended December 31, 2015:
As of/Year ended December 31, 2015
Domestic
Streaming
International
Streaming
Domestic
DVD Consolidated
(in thousands)
Total memberships at end of period (1) ..... 44,738 30,024 4,904 —
Revenues ............................ $4,180,339 $1,953,435 $645,737 $6,779,511
Cost of revenues ....................... 2,487,193 1,780,375 323,908 4,591,476
Marketing ............................ 317,646 506,446 — 824,092
Contribution profit (loss) ............ $1,375,500 $ (333,386) $321,829 $1,363,943
Other operating expenses ................ 1,058,117
Operating income .................. 305,826
Other income (expense) ................. (163,941)
Provision for income taxes ............... 19,244
Net income ....................... $ 122,641
As of/Year ended December 31, 2015
Domestic
Streaming
International
Streaming
Domestic
DVD Consolidated
(in thousands)
Amortization of content assets .............. 1,905,069 1,500,313 79,380 3,484,762
67