NetFlix 2015 Annual Report Download - page 35
Download and view the complete annual report
Please find page 35 of the 2015 NetFlix annual report below. You can navigate through the pages in the report by either clicking on the pages listed below, or by using the keyword search tool below to find specific information within the annual report.-
 1
1 -
2
-
3
-
4
-
5
-
6
-
7
-
8
-
9
-
10
-
11
-
12
-
13
-
14
-
15
-
16
-
17
-
18
-
19
-
20
-
21
-
22
-
23
-
24
-
 25
25 -
 26
26 -
 27
27 -
 28
28 -
 29
29 -
 30
30 -
 31
31 -
 32
32 -
 33
33 -
 34
34 -
 35
35 -
 36
36 -
 37
37 -
 38
38 -
 39
39 -
 40
40 -
 41
41 -
 42
42 -
 43
43 -
 44
44 -
 45
45 -
46
-
47
-
48
-
49
-
50
-
51
-
52
-
53
-
54
-
55
-
56
-
57
-
58
-
59
-
60
-
61
-
62
-
63
-
64
-
65
-
66
-
67
-
68
-
69
-
70
-
71
-
72
-
73
-
74
-
75
-
76
-
77
-
78
-
79
-
80
 |
 |

Free cash flow was $393.5 million lower than net income for the year ended December 31, 2014 primarily
due to $534.2 million of content cash payments over expense partially offset by $115.2 million of non-cash
stock-based compensation expense and $25.5 million of favorable other working capital differences.
Year ended December 31, 2014 as compared to the year ended December 31, 2013
Cash provided by operating activities decreased $81.3 million, primarily due to increased payments for
content other than DVD assets of $835.1 million or 32%, as well as increased payments associated with higher
operating expenses. The increased use of cash was partially offset by a $1,130.1 million or 26% increase in
revenues.
Cash used in investing activities decreased $213.1 million, primarily due to a decrease of $242.2 million in
the purchases of short-term investments, net of proceeds from sales and maturities. This decrease was offset by
an increase of $15.6 million purchases of property and equipment.
Cash provided by financing activities increased $65.4 million primarily due to the $392.9 million net
proceeds from the issuance of the 5.750% Notes in the year ended December 31, 2014 as compared to the $490.6
million net proceeds from the issuance of the 5.375% Notes less the $219.4 million redemption of our 8.50%
Notes in the year ended December 31, 2013. This increase was partially offset by a decrease of $56.3 million
from the issuance of common stock, including the impact of excess tax benefits.
Free cash flow was $128.7 million lower than net income for the year ended December 31, 2013 primarily
due to $227.9 million of content cash payments over expense and $45.3 million non-favorable other working
capital differences. This was partially offset by $73.1 million non-cash stock-based compensation expense, $46.3
million in deferred revenue and $25.1 million loss on debt extinguishment, the cash impact of which is a
financing activity and therefore not included in free cash flow.
Contractual Obligations
For the purpose of this table, contractual obligations for purchases of goods or services are defined as
agreements that are enforceable and legally binding and that specify all significant terms, including: fixed or
minimum quantities to be purchased; fixed, minimum or variable price provisions; and the approximate timing of
the transaction. The expected timing of the payment of the obligations discussed below is estimated based on
information available to us as of December 31, 2015. Timing of payments and actual amounts paid may be
different depending on the time of receipt of goods or services or changes to agreed-upon amounts for some
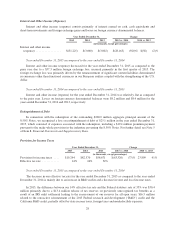
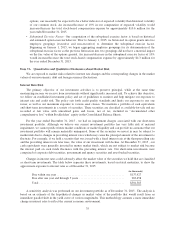
obligations. The following table summarizes our contractual obligations at December 31, 2015:
Payments due by Period
Contractual obligations (in thousands): Total
Less than
1 year 1-3 years 3-5 years
More than
5 years
Streaming content obligations (1) . . . $10,902,231 $4,703,172 $5,249,147 $ 891,864 $ 58,048
Debt (2) ....................... 3,425,813 135,375 270,750 270,750 2,748,938
Lease obligations (3) ............. 529,744 42,545 112,826 104,996 269,377
Other purchase obligations (4) ..... 322,793 217,004 105,275 170 344
Total ..................... $15,180,581 $5,098,096 $5,737,998 $1,267,780 $3,076,707
(1) As of December 31, 2015, streaming content obligations were comprised of $2.8 billion included in
“Current content liabilities” and $2.0 billion of “Non-current content liabilities” on the Consolidated
Balance Sheets and $6.1 billion of obligations that are not reflected on the Consolidated Balance Sheets as
they do not yet meet the criteria for asset recognition.
Streaming content obligations increased $1.4 billion from $9.5 billion as of December 31, 2014 to $10.9
billion as of December 31, 2015 primarily due to multi-year commitments primarily associated with the
continued expansion of our exclusive and original programing.
31