NetFlix 2015 Annual Report Download - page 60
Download and view the complete annual report
Please find page 60 of the 2015 NetFlix annual report below. You can navigate through the pages in the report by either clicking on the pages listed below, or by using the keyword search tool below to find specific information within the annual report.
4. Balance Sheet Components
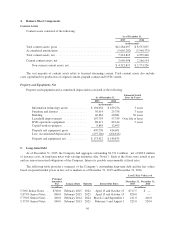
Content Assets
Content assets consisted of the following:
As of December 31,
2015 2014
(in thousands)
Total content assets, gross .................................... $12,284,097 $ 8,537,835
Accumulated amortization .................................... (5,065,282) (3,598,375)
Total content assets, net ...................................... 7,218,815 4,939,460
Current content assets, net .................................... 2,905,998 2,166,134
Non-current content assets, net ............................ $ 4,312,817 $ 2,773,326
The vast majority of content assets relate to licensed streaming content. Total content assets also include
costs capitalized for production of original content, prepaid content and DVD content.
Property and Equipment, Net
Property and equipment and accumulated depreciation consisted of the following:
As of December 31,
Estimated Useful
Lives (in Years)
2015 2014
(in thousands)
Information technology assets ............ $194,054 $ 189,274 3 years
Furniture and fixtures ................... 30,914 25,758 3 years
Building ............................. 40,681 40,681 30 years
Leasehold improvements ................ 107,793 57,339 Over life of lease
DVD operations equipment .............. 88,471 89,144 5 years
Capital work-in-progress ................ 8,845 12,495
Property and equipment, gross ............ 470,758 414,691
Less: Accumulated depreciation ........... (297,346) (264,816)
Property and equipment, net .............. $173,412 $ 149,875
5. Long-term Debt
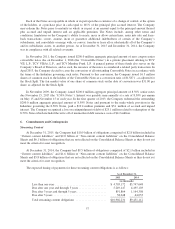
As of December 31, 2015, the Company had aggregate outstanding $2,371.4 million , net of $28.6 million
of issuance costs, in long-term notes with varying maturities (the “Notes”). Each of the Notes were issued at par
and are senior unsecured obligations of the Company. Interest is payable semi-annually at fixed rates.
The following table provides a summary of the Company’s outstanding long-term debt and the fair values
based on quoted market prices in less active markets as of December 31, 2015 and December 31, 2014:
Level 2 Fair Value as of
Principal
Amount at
Par Issuance Date Maturity Interest Due Dates
December 31,
2015
December 31,
2014
(in millions) (in millions)
5.50% Senior Notes . . . $700.0 February 2015 2022 April 15 and October 15 $717.5 $ —
5.875% Senior Notes . . 800.0 February 2015 2025 April 15 and October 15 820.0 —
5.750% Senior Notes . . 400.0 February 2014 2024 March 1 and September 1 411.0 416.0
5.375% Senior Notes . . 500.0 February 2013 2021 February 1 and August 1 525.0 520.0
56


