NetFlix 2015 Annual Report Download - page 27
Download and view the complete annual report
Please find page 27 of the 2015 NetFlix annual report below. You can navigate through the pages in the report by either clicking on the pages listed below, or by using the keyword search tool below to find specific information within the annual report.-
 1
1 -
2
-
3
-
4
-
5
-
6
-
7
-
8
-
9
-
10
-
11
-
12
-
13
-
14
-
15
-
16
-
 17
17 -
 18
18 -
 19
19 -
 20
20 -
 21
21 -
 22
22 -
 23
23 -
 24
24 -
 25
25 -
 26
26 -
 27
27 -
 28
28 -
 29
29 -
 30
30 -
 31
31 -
 32
32 -
 33
33 -
 34
34 -
 35
35 -
 36
36 -
 37
37 -
38
-
39
-
40
-
41
-
42
-
43
-
44
-
45
-
46
-
47
-
48
-
49
-
50
-
51
-
52
-
53
-
54
-
55
-
56
-
57
-
58
-
59
-
60
-
61
-
62
-
63
-
64
-
65
-
66
-
67
-
68
-
69
-
70
-
71
-
72
-
73
-
74
-
75
-
76
-
77
-
78
-
79
-
80
 |
 |
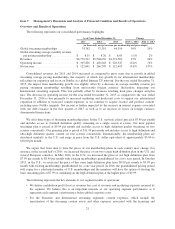
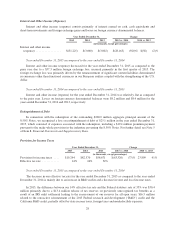
Year ended December 31, 2015 as compared to the year ended December 31, 2014
In the Domestic streaming segment, we derive revenues from monthly membership fees for services
consisting solely of streaming content to our members in the United States. Our two screen high definition plan
continues to be the most popular plan choice for new memberships. The increase in our domestic streaming
revenues was due to a 17% growth in the average number of paid memberships and a 4% increase in average
monthly revenue per paying membership resulting from our price changes and plan mix.
The increase in domestic streaming cost of revenues was primarily due to a $208.1 million increase in
content expenses relating to our existing and new streaming content, including more exclusive and original
programming. In addition, we had a $37.9 million increase in streaming delivery expenses and a $39.4 million
increase in other costs, such as payment processing fees and customer service call centers, due to our growing
member base.
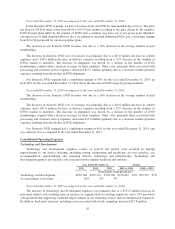
Domestic marketing expenses increased primarily due to an increase in advertising and public relations
spending.
Our Domestic streaming segment had a contribution margin of 33% for the year ended December 31, 2015,
which increased as compared to the contribution margin of 27% for the year ended December 31, 2014 due to
growth in paid memberships and revenue, which continued to outpace content and marketing spending. Our 2020
domestic streaming contribution margin target remains at 40%.
Year ended December 31, 2014 as compared to the year ended December 31, 2013
The increase in our domestic streaming revenues was due to the 22% growth in the average number of paid
memberships, as well as to the 2% increase in average monthly revenue per paying membership resulting from
our price increase for new members in the second quarter of 2014 and introduction of the higher priced plan in
2013.
The increase in domestic streaming cost of revenues was primarily due to the $242.3 million increase in
content expenses relating to our existing and new streaming content, including more exclusive and original
programming. In addition, streaming delivery expenses increased by $59.5 million and other costs, such as
payment processing fees and customer service call centers, increased $36.6 million due to our growing member
base.
Domestic marketing expenses increased primarily due to an increase in advertising and public relations
spending.
Our Domestic streaming segment had a contribution margin of 27% for the year ended December 31, 2014,
which increased as compared to the contribution margin of 23% for the year ended December 31, 2013 due to
growth in paid memberships and revenue, which continued to outpace content and marketing spending.
23