NetFlix 2015 Annual Report Download - page 23
Download and view the complete annual report
Please find page 23 of the 2015 NetFlix annual report below. You can navigate through the pages in the report by either clicking on the pages listed below, or by using the keyword search tool below to find specific information within the annual report.-
 1
1 -
2
-
3
-
4
-
5
-
6
-
7
-
8
-
9
-
10
-
11
-
12
-
 13
13 -
 14
14 -
 15
15 -
 16
16 -
 17
17 -
 18
18 -
 19
19 -
 20
20 -
 21
21 -
 22
22 -
 23
23 -
 24
24 -
 25
25 -
 26
26 -
 27
27 -
 28
28 -
 29
29 -
 30
30 -
 31
31 -
 32
32 -
 33
33 -
34
-
35
-
36
-
37
-
38
-
39
-
40
-
41
-
42
-
43
-
44
-
45
-
46
-
47
-
48
-
49
-
50
-
51
-
52
-
53
-
54
-
55
-
56
-
57
-
58
-
59
-
60
-
61
-
62
-
63
-
64
-
65
-
66
-
67
-
68
-
69
-
70
-
71
-
72
-
73
-
74
-
75
-
76
-
77
-
78
-
79
-
80
 |
 |

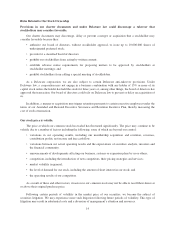
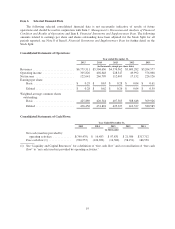
Item 6. Selected Financial Data
The following selected consolidated financial data is not necessarily indicative of results of future
operations and should be read in conjunction with Item 7, Management’s Discussion and Analysis of Financial
Condition and Results of Operations and Item 8, Financial Statements and Supplementary Data. The following
amounts related to earnings per share and shares outstanding have been adjusted for the Stock Split for all
periods reported, see Note 8 of Item 8, Financial Statements and Supplementary Data for further detail on the
Stock Split.
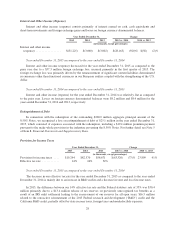
Consolidated Statements of Operations:
Year ended December 31,
2015 2014 2013 2012 2011
(in thousands, except per share data)
Revenues ............................ $6,779,511 $5,504,656 $4,374,562 $3,609,282 $3,204,577
Operating income ..................... 305,826 402,648 228,347 49,992 376,068
Net income .......................... 122,641 266,799 112,403 17,152 226,126
Earnings per share:
Basic ........................... $ 0.29 $ 0.63 $ 0.28 $ 0.04 $ 0.61
Diluted .......................... $ 0.28 $ 0.62 $ 0.26 $ 0.04 $ 0.59
Weighted-average common shares
outstanding:
Basic ........................... 425,889 420,544 407,385 388,648 369,926
Diluted .......................... 436,456 431,894 425,327 412,327 380,585
Consolidated Statements of Cash Flows:
Year Ended December 31,
2015 2014 2013 2012 2011
(in thousands)
Net cash (used in) provided by
operating activities ............ $(749,439) $ 16,483 $ 97,831 $ 21,586 $317,712
Free cash flow (1) ............... (920,557) (126,699) (16,300) (58,151) 186,550
(1) See “Liquidity and Capital Resources” for a definition of “free cash flow” and a reconciliation of “free cash
flow” to “net cash (used in) provided by operating activities.”
19