NetFlix 2015 Annual Report Download - page 26
Download and view the complete annual report
Please find page 26 of the 2015 NetFlix annual report below. You can navigate through the pages in the report by either clicking on the pages listed below, or by using the keyword search tool below to find specific information within the annual report.
acquisition of streaming content, represent the vast majority of cost of revenues. Streaming content rights
were generally obtained for our current geographic regions. As we expanded internationally, we obtained
additional rights for the new geographies. With our global expansion, we now aspire to obtain global
rights for our new content. We allocate this content between the Domestic and International segments
based on estimated fair market value. Other cost of revenues such as streaming delivery expenses,
customer service and payment processing fees, including those we pay to our integrated payment
partners, tend to be lower as a percentage of total cost of revenues as compared to content licensing
expenses. We have built our own global content delivery network (“Open Connect”) to help us efficiently
stream a high volume of content to our members over the Internet. Streaming delivery expenses,
therefore, also include equipment costs related to our content delivery network and all third-party costs,
such as cloud computing costs, associated with delivering streaming content over the Internet. Cost of
revenues in the Domestic DVD segment consist primarily of delivery expenses, content expenses,
including amortization of DVD content assets and revenue sharing expenses, and other expenses
associated with our DVD processing and customer service centers. Delivery expenses for the Domestic
DVD segment consist of the postage costs to mail DVDs to and from our members and the packaging
and label costs for the mailers.
• For the Domestic and International streaming segments, marketing expenses consist primarily of
advertising expenses and payments made to our affiliates and device partners. Advertising expenses
include promotional activities such as digital and television advertising. Payments to our affiliates and
device partners include fixed fee and /or revenue sharing payments. Marketing expenses are incurred by
our Domestic and International streaming segments given our focus on building consumer awareness of
the streaming offerings and in particular our original content. Marketing expenses incurred by our
International streaming segment have been significant and fluctuate dependent upon the number of
international territories in which our streaming service is offered and the timing of the launch of new
territories. We do not incur marketing expenses for the Domestic DVD segment.
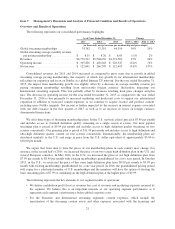
• We have demonstrated our ability to grow domestic streaming contribution margin as evidenced by the
increase in contribution margin from 17% in 2012 to 33% in 2015. As a result of our focus on growing
the streaming segments, contribution margins for the Domestic and International streaming segments are
lower than for our Domestic DVD segment.
Segment Results
Domestic Streaming Segment
As of/ Year Ended December 31, Change
2015 2014 2013 2015 vs. 2014 2014 vs. 2013
(in thousands, except revenue per membership and percentages)
Memberships:
Net additions ................ 5,624 5,694 6,274 (70) (1)% (580) (9)%
Memberships at end of period . . . 44,738 39,114 33,420 5,624 14% 5,694 17%
Paid memberships at end of
period .................... 43,401 37,698 31,712 5,703 15% 5,986 19%
Average monthly revenue per
paying membership ......... $ 8.50 $ 8.14 $ 7.97 $ 0.36 4% $ 0.17 2%
Contribution profit:
Revenues ................... $4,180,339 $3,431,434 $2,751,375 $748,905 22% $680,059 25%
Cost of revenues ............. 2,487,193 2,201,761 1,863,376 285,432 13% 338,385 18%
Marketing .................. 317,646 293,453 265,232 24,193 8% 28,221 11%
Contribution profit ............ 1,375,500 936,220 622,767 439,280 47% 313,453 50%
Contribution margin .......... 33% 27% 23%
22


