NetFlix 2015 Annual Report Download - page 30
Download and view the complete annual report
Please find page 30 of the 2015 NetFlix annual report below. You can navigate through the pages in the report by either clicking on the pages listed below, or by using the keyword search tool below to find specific information within the annual report.-
 1
1 -
2
-
3
-
4
-
5
-
6
-
7
-
8
-
9
-
10
-
11
-
12
-
13
-
14
-
15
-
16
-
17
-
18
-
19
-
 20
20 -
 21
21 -
 22
22 -
 23
23 -
 24
24 -
 25
25 -
 26
26 -
 27
27 -
 28
28 -
 29
29 -
 30
30 -
 31
31 -
 32
32 -
 33
33 -
 34
34 -
 35
35 -
 36
36 -
 37
37 -
 38
38 -
 39
39 -
 40
40 -
41
-
42
-
43
-
44
-
45
-
46
-
47
-
48
-
49
-
50
-
51
-
52
-
53
-
54
-
55
-
56
-
57
-
58
-
59
-
60
-
61
-
62
-
63
-
64
-
65
-
66
-
67
-
68
-
69
-
70
-
71
-
72
-
73
-
74
-
75
-
76
-
77
-
78
-
79
-
80
 |
 |

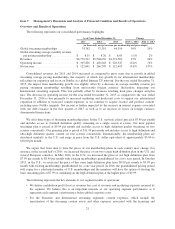
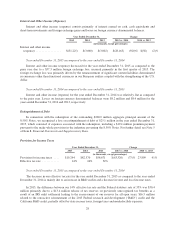
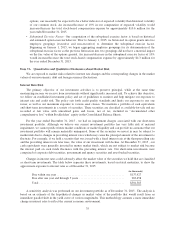
Year ended December 31, 2015 as compared to the year ended December 31, 2014
In the Domestic DVD segment, we derive revenues from our DVD-by-mail membership services. The price
per plan for DVD-by-mail varies from $4.99 to $15.99 per month according to the plan chosen by the member.
DVD-by-mail plans differ by the number of DVDs that a member may have out at any given point. Members
electing access to high definition Blu-ray discs, in addition to standard definition DVDs, pay a surcharge ranging
from $2 to $4 per month for our most popular plans.
The decrease in our domestic DVD revenues was due to a 16% decrease in the average number of paid
memberships.
The decrease in domestic DVD cost of revenues was primarily due to a $21.0 million decrease in content
expenses and a $38.9 million decrease in delivery expenses resulting from a 21% decrease in the number of
DVDs mailed to members. The decrease in shipments was driven by a decline in the number of DVD
memberships coupled with a decrease in usage by these members. Other costs, primarily those associated with
processing and customer service expenses, decreased $13.1 million primarily due to a decrease in hub operation
expenses resulting from the decline in DVD shipments.
Our Domestic DVD segment had a contribution margin of 50% for the year ended December 31, 2015, up
from 48% for the year ended December 31, 2014 due to the decrease in DVD usage by paying members.
Year ended December 31, 2014 as compared to the year ended December 31, 2013
The decrease in our domestic DVD revenues was due to a 16% decrease in the average number of paid
memberships.
The decrease in domestic DVD cost of revenues was primarily due to a $16.0 million decrease in content
expenses and a $43.0 million decrease in delivery expenses resulting from a 22% decrease in the number of
DVDs mailed to members. The decrease in shipments was driven by a decline in the number of DVD
memberships coupled with a decrease in usage by these members. Other costs, primarily those associated with
processing and customer service expenses, decreased $15.6 million primarily due to a decrease in hub operation
expenses resulting from the decline in DVD shipments.
Our Domestic DVD segment had a contribution margin of 48% for the year ended December 31, 2014, and
was relatively flat as compared to the year ended December 31, 2013.
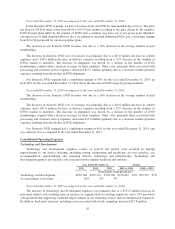
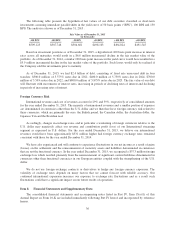
Consolidated Operating Expenses
Technology and Development
Technology and development expenses consist of payroll and related costs incurred in making
improvements to our service offerings, including testing, maintaining and modifying our user interface, our
recommendation, merchandising and streaming delivery technology and infrastructure. Technology and
development expenses also include costs associated with computer hardware and software.
Year Ended December 31, Change
2015 2014 2013 2015 vs. 2014 2014 vs. 2013
(in thousands, except percentages)
Technology and development ........... $650,788 $472,321 $378,769 $178,467 38% $93,552 25%
As a percentage of revenues ............. 10% 9% 9%
Year ended December 31, 2015 as compared to the year ended December 31, 2014
The increase in technology and development expenses was primarily due to a $133.2 million increase in
personnel-related costs resulting from an increase in compensation for existing employees and a 20% growth in
average headcount supporting continued improvements in our streaming service and our international expansion.
In addition, third party expenses, including costs associated with cloud computing, increased $23.8 million.
26