NetFlix 2015 Annual Report Download - page 28
Download and view the complete annual report
Please find page 28 of the 2015 NetFlix annual report below. You can navigate through the pages in the report by either clicking on the pages listed below, or by using the keyword search tool below to find specific information within the annual report.
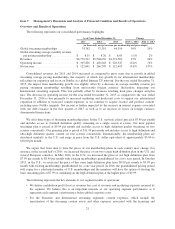
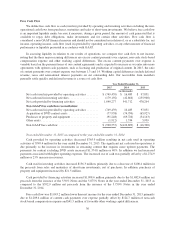
International Streaming Segment
As of/ Year Ended December 31, Change
2015 2014 2013 2015 vs. 2014 2014 vs. 2013
(in thousands, except revenue per membership and percentages)
Memberships:
Net additions .......... 11,747 7,347 4,809 4,400 60% 2,538 53%
Memberships at end of
period .............. 30,024 18,277 10,930 11,747 64% 7,347 67%
Paid memberships at end
of period ........... 27,438 16,778 9,722 10,660 64% 7,056 73%
Average monthly revenue
per paying
membership ......... $ 7.48 $ 8.34 $ 8.26 $ (0.86) (10)% $ 0.08 1%
Contribution loss:
Revenues ............. $1,953,435 $1,308,061 $ 712,390 $ 645,374 49% $595,671 84%
Cost of revenues ....... 1,780,375 1,154,117 782,304 626,258 54% 371,813 48%
Marketing ............ 506,446 313,733 204,418 192,713 61% 109,315 53%
Contribution loss ....... (333,386) (159,789) (274,332) (173,597) 109% 114,543 (42)%
Contribution margin .... (17)% (12)% (39)%
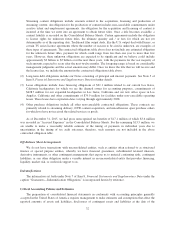
In the International streaming segment, we derive revenues from monthly membership fees for services
consisting solely of streaming content to our members outside the United States. We launched our streaming
service in Canada in September 2010 and have continuously expanded our services internationally as shown
below. In January 2016 we announced the availability of our streaming service virtually everywhere in the world,
with the exception of The People’s Republic of China and territories where U.S. companies are not allowed to
operate.
September
2010
September
2011
January
2012
October
2012
September
2013
September
2014
March
2015
September
2015
October
2015
Canada Latin America United Kingdom Finland Netherlands Germany Australia Japan Spain
Ireland Denmark Austria New Zealand Portugal
Sweden Switzerland Italy
Norway France
Belgium
Luxemburg
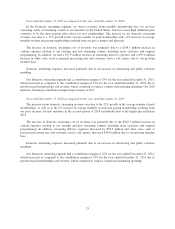
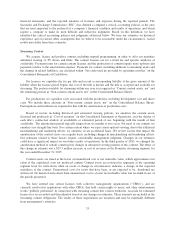
Year ended December 31, 2015 as compared to the year ended December 31, 2014
The increase in our international revenues was due to the 66% growth in the average number of paid
international memberships offset partially by a 10% decrease in average monthly revenue per paying
membership. The decrease in average monthly revenue per paying membership was due to the impact of
exchange rate fluctuations and to a lesser extent the impact of absorbing higher VAT rates across our European
markets beginning January 1, 2015. These decreases were partially offset by our pricing changes and plan mix.
We believe international revenues would have been approximately $331 million higher in 2015 if foreign
exchange rates had remained consistent with those for the year ended December 31, 2014.
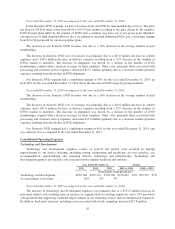
The increase in international cost of revenues was primarily due to a $522.1 million increase in content
expenses primarily relating to expenses for territories launched in the last eighteen months, coupled with existing
and new streaming content, including more exclusive and original programming. Other costs increased $104.2
24


