NetFlix 2015 Annual Report Download - page 48
Download and view the complete annual report
Please find page 48 of the 2015 NetFlix annual report below. You can navigate through the pages in the report by either clicking on the pages listed below, or by using the keyword search tool below to find specific information within the annual report.-
 1
1 -
2
-
3
-
4
-
5
-
6
-
7
-
8
-
9
-
10
-
11
-
12
-
13
-
14
-
15
-
16
-
17
-
18
-
19
-
20
-
21
-
22
-
23
-
24
-
25
-
26
-
27
-
28
-
29
-
30
-
31
-
32
-
33
-
34
-
35
-
36
-
37
-
 38
38 -
 39
39 -
 40
40 -
 41
41 -
 42
42 -
 43
43 -
 44
44 -
 45
45 -
 46
46 -
 47
47 -
 48
48 -
 49
49 -
 50
50 -
 51
51 -
 52
52 -
 53
53 -
 54
54 -
 55
55 -
 56
56 -
 57
57 -
 58
58 -
59
-
60
-
61
-
62
-
63
-
64
-
65
-
66
-
67
-
68
-
69
-
70
-
71
-
72
-
73
-
74
-
75
-
76
-
77
-
78
-
79
-
80
 |
 |

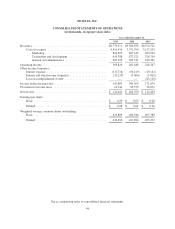
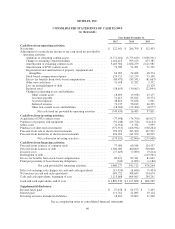
NETFLIX, INC.
CONSOLIDATED STATEMENTS OF OPERATIONS
(in thousands, except per share data)
Year ended December 31,
2015 2014 2013
Revenues .................................................. $6,779,511 $5,504,656 $4,374,562
Cost of revenues ........................................ 4,591,476 3,752,760 3,117,203
Marketing ......................................... 824,092 607,186 469,942
Technology and development .......................... 650,788 472,321 378,769
General and administrative ............................ 407,329 269,741 180,301
Operating income ........................................... 305,826 402,648 228,347
Other income (expense):
Interest expense ......................................... (132,716) (50,219) (29,142)
Interest and other income (expense) ......................... (31,225) (3,060) (3,002)
Loss on extinguishment of debt ............................ — — (25,129)
Income before income taxes ................................... 141,885 349,369 171,074
Provision for income taxes .................................... 19,244 82,570 58,671
Net income ................................................ $ 122,641 $ 266,799 $ 112,403
Earnings per share:
Basic ................................................. $ 0.29 $ 0.63 $ 0.28
Diluted ................................................ $ 0.28 $ 0.62 $ 0.26
Weighted-average common shares outstanding:
Basic ................................................. 425,889 420,544 407,385
Diluted ................................................ 436,456 431,894 425,327
See accompanying notes to consolidated financial statements.
44