NetFlix 2015 Annual Report Download - page 65
Download and view the complete annual report
Please find page 65 of the 2015 NetFlix annual report below. You can navigate through the pages in the report by either clicking on the pages listed below, or by using the keyword search tool below to find specific information within the annual report.-
 1
1 -
2
-
3
-
4
-
5
-
6
-
7
-
8
-
9
-
10
-
11
-
12
-
13
-
14
-
15
-
16
-
17
-
18
-
19
-
20
-
21
-
22
-
23
-
24
-
25
-
26
-
27
-
28
-
29
-
30
-
31
-
32
-
33
-
34
-
35
-
36
-
37
-
38
-
39
-
40
-
41
-
42
-
43
-
44
-
45
-
46
-
47
-
48
-
49
-
50
-
51
-
52
-
53
-
54
-
 55
55 -
 56
56 -
 57
57 -
 58
58 -
 59
59 -
 60
60 -
 61
61 -
 62
62 -
 63
63 -
 64
64 -
 65
65 -
 66
66 -
 67
67 -
 68
68 -
 69
69 -
 70
70 -
 71
71 -
 72
72 -
 73
73 -
 74
74 -
 75
75 -
76
-
77
-
78
-
79
-
80
 |
 |

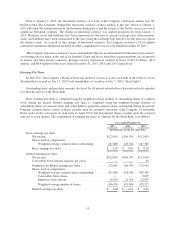
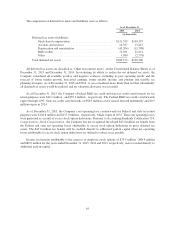
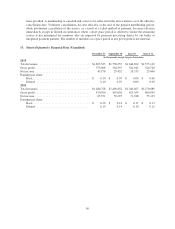
On June 23, 2015, the Company’s Board of Directors declared a seven -for-one stock split in the form of a
stock dividend that was paid on July 14, 2015 to all shareholders of record as of July 2, 2015. Outstanding share
and per-share amounts disclosed for all periods presented have been retroactively adjusted to reflect the effects of
the Stock Split.
Preferred Stock
The Company has authorized 10,000,000 shares of undesignated preferred stock with a par value of $0.001
per share. None of the preferred shares were issued and outstanding at December 31, 2015 and 2014.
Voting Rights
The holders of each share of common stock shall be entitled to one vote per share on all matters to be voted
upon by the Company’s stockholders.
Stock Option Plans
In June 2011, the Company adopted the 2011 Stock Plan. The 2011 Stock Plan provides for the grant of
incentive stock options to employees and for the grant of non-statutory stock options, stock appreciation rights,
restricted stock and restricted stock units to employees, directors and consultants. As of December 31, 2015,
16.8 million shares were reserved for future grants under the 2011 Stock Plan.
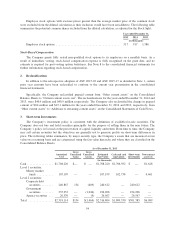
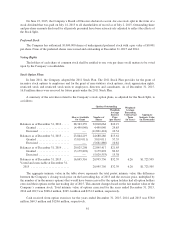
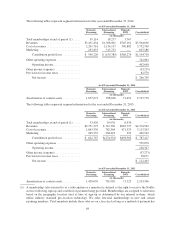
A summary of the activities related to the Company’s stock option plans, as adjusted for the Stock Split, is
as follows:
Shares Available
for Grant
Options Outstanding Weighted-
Average
Remaining
Contractual
Term
(in Years)
Aggregate
Intrinsic Value
(in Thousands)
Number of
Shares
Weighted-
Average
Exercise
Price
(per Share)
Balances as of December 31, 2012 ..... 28,343,259 32,010,664 $10.19
Granted ...................... (4,499,040) 4,499,040 29.85
Exercised ..................... — (11,821,418) 10.54
Balances as of December 31, 2013 ..... 23,844,219 24,688,286 $13.61
Granted ...................... (3,819,011) 3,819,011 57.55
Exercised ..................... — (5,661,880) 10.81
Balances as of December 31, 2014 ..... 20,025,208 22,845,417 $21.65
Granted ...................... (3,179,892) 3,179,892 82.67
Exercised ..................... — (5,029,553) 15.38
Balances as of December 31, 2015 ..... 16,845,316 20,995,756 $32.39 6.26 $1,723,505
Vested and exercisable at December 31,
2015 .......................... 20,995,756 $32.39 6.26 $1,723,505
The aggregate intrinsic value in the table above represents the total pretax intrinsic value (the difference
between the Company’s closing stock price on the last trading day of 2015 and the exercise price, multiplied by
the number of in-the-money options) that would have been received by the option holders had all option holders
exercised their options on the last trading day of 2015. This amount changes based on the fair market value of the
Company’s common stock. Total intrinsic value of options exercised for the years ended December 31, 2015,
2014 and 2013 was $368.4 million, $265.1 million and $274.2 million, respectively.
Cash received from option exercises for the years ended December 31, 2015, 2014 and 2013 was $78.0
million, $60.5 million and $124.6 million, respectively.
61