NetFlix 2015 Annual Report Download - page 29
Download and view the complete annual report
Please find page 29 of the 2015 NetFlix annual report below. You can navigate through the pages in the report by either clicking on the pages listed below, or by using the keyword search tool below to find specific information within the annual report.-
 1
1 -
2
-
3
-
4
-
5
-
6
-
7
-
8
-
9
-
10
-
11
-
12
-
13
-
14
-
15
-
16
-
17
-
18
-
 19
19 -
 20
20 -
 21
21 -
 22
22 -
 23
23 -
 24
24 -
 25
25 -
 26
26 -
 27
27 -
 28
28 -
 29
29 -
 30
30 -
 31
31 -
 32
32 -
 33
33 -
 34
34 -
 35
35 -
 36
36 -
 37
37 -
 38
38 -
 39
39 -
40
-
41
-
42
-
43
-
44
-
45
-
46
-
47
-
48
-
49
-
50
-
51
-
52
-
53
-
54
-
55
-
56
-
57
-
58
-
59
-
60
-
61
-
62
-
63
-
64
-
65
-
66
-
67
-
68
-
69
-
70
-
71
-
72
-
73
-
74
-
75
-
76
-
77
-
78
-
79
-
80
 |
 |

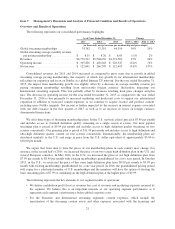
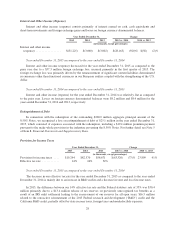
million primarily due to increases in our streaming delivery expenses, costs associated with our customer service
call centers and payment processing fees, all driven by our growing member base, partially offset by decreases
resulting from exchange rate fluctuations. Average paid international streaming memberships accounted for 35%
of total average paid streaming memberships as of December 31, 2015, as compared to 27% of total average paid
streaming memberships as of December 31, 2014.
International marketing expenses for the year ended December 31, 2015 increased as compared to the year
ended December 31, 2014 mainly due to expenses for territories launched in the last eighteen months.
International contribution losses increased $173.6 million year over year due to our increased spending for
our international expansion and the impact of foreign currency exchange rate fluctuations.
Year ended December 31, 2014 as compared to the year ended December 31, 2013
The increase in our international revenues was primarily due to the 82% growth in the average number of
paid international memberships as well as the 1% increase in average monthly revenue per paying member
resulting from the price increase on our most popular streaming plan and the introduction of the premium plan,
offset partially by the impact of exchange rate fluctuations. Average paid international streaming memberships
accounted for 27% of total average paid streaming memberships as of December 31, 2014, as compared to 20%
of total average paid streaming memberships as of December 31, 2013.
The increase in international cost of revenues was primarily due to a $311.5 million increase in content
expenses including content for our new markets as well as more exclusive and original programming. Other costs
increased $60.3 million primarily due to increases in our streaming delivery expenses, costs associated with our
customer service call centers and payment processing fees, all driven by our growing member base.
International marketing expenses for the year ended December 31, 2014 increased as compared to the year
ended December 31, 2013 mainly due to expenses for territories launched during 2014.
International contribution losses improved $114.5 million year over year, as a result of growing
memberships and revenues faster than content and marketing spending.
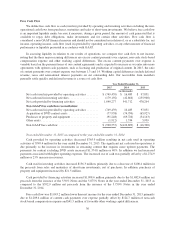
Domestic DVD Segment
As of/ Year Ended December 31, Change
2015 2014 2013 2015 vs. 2014 2014 vs. 2013
(in thousands, except revenue per membership and percentages)
Memberships:
Net losses ........... (863) (1,163) (1,294) (300) (26)% (131) (10)%
Memberships at end of
period ............ 4,904 5,767 6,930 (863) (15)% (1,163) (17)%
Paid memberships at
end of period ...... 4,787 5,668 6,765 (881) (16)% (1,097) (16)%
Average monthly
revenue per paying
membership ....... $ 10.30 $ 10.29 $ 10.25 $ 0.01 — % $ 0.04 — %
Contribution profit:
Revenues ........... $645,737 $765,161 $910,797 $(119,424) (16)% $(145,636) (16)%
Cost of revenues ..... 323,908 396,882 471,523 (72,974) (18)% (74,641) (16)%
Marketing .......... — — 292 — — % (292) (100)%
Contribution profit . . . 321,829 368,279 438,982 (46,450) (13)% (70,703) (16)%
Contribution margin . . 50% 48% 48%
25