NetFlix 2015 Annual Report Download - page 50
Download and view the complete annual report
Please find page 50 of the 2015 NetFlix annual report below. You can navigate through the pages in the report by either clicking on the pages listed below, or by using the keyword search tool below to find specific information within the annual report.-
 1
1 -
2
-
3
-
4
-
5
-
6
-
7
-
8
-
9
-
10
-
11
-
12
-
13
-
14
-
15
-
16
-
17
-
18
-
19
-
20
-
21
-
22
-
23
-
24
-
25
-
26
-
27
-
28
-
29
-
30
-
31
-
32
-
33
-
34
-
35
-
36
-
37
-
38
-
39
-
 40
40 -
 41
41 -
 42
42 -
 43
43 -
 44
44 -
 45
45 -
 46
46 -
 47
47 -
 48
48 -
 49
49 -
 50
50 -
 51
51 -
 52
52 -
 53
53 -
 54
54 -
 55
55 -
 56
56 -
 57
57 -
 58
58 -
 59
59 -
 60
60 -
61
-
62
-
63
-
64
-
65
-
66
-
67
-
68
-
69
-
70
-
71
-
72
-
73
-
74
-
75
-
76
-
77
-
78
-
79
-
80
 |
 |

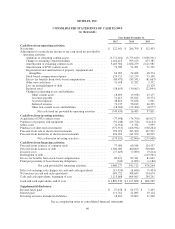
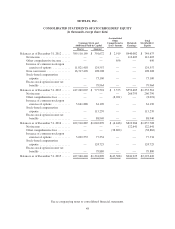
NETFLIX, INC.
CONSOLIDATED STATEMENTS OF CASH FLOWS
(in thousands)
Year Ended December 31,
2015 2014 2013
Cash flows from operating activities:
Net income .................................................. $ 122,641 $ 266,799 $ 112,403
Adjustments to reconcile net income to net cash (used in) provided by
operating activities:
Additions to streaming content assets .......................... (5,771,652) (3,773,019) (3,030,701)
Change in streaming content liabilities ......................... 1,162,413 593,125 673,785
Amortization of streaming content assets ....................... 3,405,382 2,656,279 2,121,981
Amortization of DVD content assets .......................... 79,380 71,491 71,325
Depreciation and amortization of property, equipment and
intangibles ............................................. 62,283 54,028 48,374
Stock-based compensation expense ........................... 124,725 115,239 73,100
Excess tax benefits from stock-based compensation .............. (80,471) (89,341) (81,663)
Other non-cash items ...................................... 31,628 15,282 5,332
Loss on extinguishment of debt .............................. — — 25,129
Deferred taxes ............................................ (58,655) (30,063) (22,044)
Changes in operating assets and liabilities:
Other current assets .................................... 18,693 (9,198) 43,177
Accounts payable ..................................... 51,615 83,812 18,374
Accrued expenses ..................................... 48,810 55,636 1,941
Deferred revenue ..................................... 72,135 58,819 46,295
Other non-current assets and liabilities ..................... (18,366) (52,406) (8,977)
Net cash (used in) provided by operating activities ....... (749,439) 16,483 97,831
Cash flows from investing activities:
Acquisition of DVD content assets ................................ (77,958) (74,790) (65,927)
Purchases of property and equipment .............................. (91,248) (69,726) (54,143)
Other assets .................................................. (1,912) 1,334 5,939
Purchases of short-term investments .............................. (371,915) (426,934) (550,264)
Proceeds from sale of short-term investments ....................... 259,079 385,300 347,502
Proceeds from maturities of short-term investments .................. 104,762 141,950 60,925
Net cash used in investing activities ................... (179,192) (42,866) (255,968)
Cash flows from financing activities:
Proceeds from issuance of common stock .......................... 77,980 60,544 124,557
Proceeds from issuance of debt .................................. 1,500,000 400,000 500,000
Issuance costs ................................................ (17,629) (7,080) (9,414)
Redemption of debt ............................................ — — (219,362)
Excess tax benefits from stock-based compensation .................. 80,471 89,341 81,663
Principal payments of lease financing obligations .................... (545) (1,093) (1,180)
Net cash provided by financing activities ............. 1,640,277 541,712 476,264
Effect of exchange rate changes on cash and cash equivalents ........ (15,924) (6,686) (3,453)
Net increase in cash and cash equivalents .......................... 695,722 508,643 314,674
Cash and cash equivalents, beginning of year ....................... 1,113,608 604,965 290,291
Cash and cash equivalents, end of year ........................... $1,809,330 $ 1,113,608 $ 604,965
Supplemental disclosure:
Income taxes paid ........................................... $ 27,658 $ 50,573 $ 7,465
Interest paid ................................................. 111,761 41,085 19,114
Investing activities included in liabilities ........................... 18,824 23,802 11,508
See accompanying notes to consolidated financial statements.
46