NetFlix 2015 Annual Report Download - page 52
Download and view the complete annual report
Please find page 52 of the 2015 NetFlix annual report below. You can navigate through the pages in the report by either clicking on the pages listed below, or by using the keyword search tool below to find specific information within the annual report.-
 1
1 -
2
-
3
-
4
-
5
-
6
-
7
-
8
-
9
-
10
-
11
-
12
-
13
-
14
-
15
-
16
-
17
-
18
-
19
-
20
-
21
-
22
-
23
-
24
-
25
-
26
-
27
-
28
-
29
-
30
-
31
-
32
-
33
-
34
-
35
-
36
-
37
-
38
-
39
-
40
-
41
-
 42
42 -
 43
43 -
 44
44 -
 45
45 -
 46
46 -
 47
47 -
 48
48 -
 49
49 -
 50
50 -
 51
51 -
 52
52 -
 53
53 -
 54
54 -
 55
55 -
 56
56 -
 57
57 -
 58
58 -
 59
59 -
 60
60 -
 61
61 -
 62
62 -
63
-
64
-
65
-
66
-
67
-
68
-
69
-
70
-
71
-
72
-
73
-
74
-
75
-
76
-
77
-
78
-
79
-
80
 |
 |

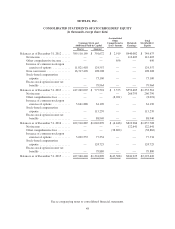
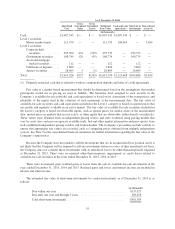
NETFLIX, INC.
CONSOLIDATED STATEMENTS OF STOCKHOLDERS’ EQUITY
(in thousands, except share data)
Common Stock and
Additional Paid-in Capital
Accumulated
Other
Comprehensive
(Loss) Income
Retained
Earnings
Total
Stockholders’
Equity
Shares Amount
Balances as of December 31, 2012 ...... 389,110,169 $ 301,672 $ 2,919 $440,082 $ 744,673
Net income .................... — — — 112,403 112,403
Other comprehensive income ...... — — 656 — 656
Issuance of common stock upon
exercise of options ............ 11,821,418 124,557 — — 124,557
Note conversion ................ 16,317,420 198,208 — — 198,208
Stock-based compensation
expense ..................... — 73,100 — — 73,100
Excess stock option income tax
benefits ..................... — 79,964 — — 79,964
Balances as of December 31, 2013 ...... 417,249,007 $ 777,501 $ 3,575 $552,485 $1,333,561
Net income .................... — — — 266,799 266,799
Other comprehensive loss ......... — — (8,021) — (8,021)
Issuance of common stock upon
exercise of options ............ 5,661,880 61,190 — — 61,190
Stock-based compensation
expense ..................... — 115,239 — — 115,239
Excess stock option income tax
benefits ..................... — 88,940 — — 88,940
Balances as of December 31, 2014 ...... 422,910,887 $1,042,870 $ (4,446) $819,284 $1,857,708
Net income .................... — — — 122,641 122,641
Other comprehensive loss ......... — — (38,862) — (38,862)
Issuance of common stock upon
exercise of options ............ 5,029,553 77,334 — — 77,334
Stock-based compensation
expense ..................... — 124,725 — — 124,725
Excess stock option income tax
benefits ..................... — 79,880 — — 79,880
Balances as of December 31, 2015 ...... 427,940,440 $1,324,809 $(43,308) $941,925 $2,223,426
See accompanying notes to consolidated financial statements.
48