NetFlix 2015 Annual Report Download - page 59
Download and view the complete annual report
Please find page 59 of the 2015 NetFlix annual report below. You can navigate through the pages in the report by either clicking on the pages listed below, or by using the keyword search tool below to find specific information within the annual report.-
 1
1 -
2
-
3
-
4
-
5
-
6
-
7
-
8
-
9
-
10
-
11
-
12
-
13
-
14
-
15
-
16
-
17
-
18
-
19
-
20
-
21
-
22
-
23
-
24
-
25
-
26
-
27
-
28
-
29
-
30
-
31
-
32
-
33
-
34
-
35
-
36
-
37
-
38
-
39
-
40
-
41
-
42
-
43
-
44
-
45
-
46
-
47
-
48
-
 49
49 -
 50
50 -
 51
51 -
 52
52 -
 53
53 -
 54
54 -
 55
55 -
 56
56 -
 57
57 -
 58
58 -
 59
59 -
 60
60 -
 61
61 -
 62
62 -
 63
63 -
 64
64 -
 65
65 -
 66
66 -
 67
67 -
 68
68 -
 69
69 -
70
-
71
-
72
-
73
-
74
-
75
-
76
-
77
-
78
-
79
-
80
 |
 |

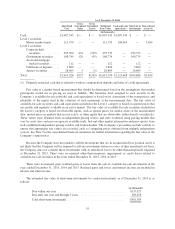
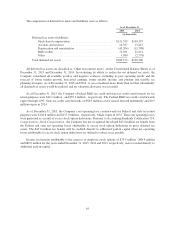
As of December 31, 2014
Amortized
Cost
Gross
Unrealized
Gains
Gross
Unrealized
Losses
Estimated
Fair Value
Cash and cash
equivalents
Short-term
investments
Non-current
assets (1)
(in thousands)
Cash ...................... $1,007,543 $— $ — $1,007,543 $1,007,543 $ — $ —
Level 1 securities:
Money market funds ..... 111,759 — — 111,759 106,065 — 5,694
Level 2 securities:
Corporate debt
securities ............ 295,500 432 (199) 295,733 — 295,733 —
Government securities .... 168,749 120 (95) 168,774 — 168,774 —
Asset and mortgage-
backed securities ...... 112 — — 112 — 112 —
Certificate of deposits .... 3,600 — — 3,600 — 3,600 —
Agency securities ....... 26,665 5 (1) 26,669 — 26,669 —
Total ..................... $1,613,928 $557 $(295) $1,614,190 $1,113,608 $494,888 $5,694
(1) Primarily restricted cash that is related to workers compensation deposits and letter of credit agreements.
Fair value is a market-based measurement that should be determined based on the assumptions that market
participants would use in pricing an asset or liability. The hierarchy level assigned to each security in the
Company’s available-for-sale portfolio and cash equivalents is based on its assessment of the transparency and
reliability of the inputs used in the valuation of such instrument at the measurement date. The fair value of
available-for-sale securities and cash equivalents included in the Level 1 category is based on quoted prices that
are readily and regularly available in an active market. The fair value of available-for-sale securities included in
the Level 2 category is based on observable inputs, such as quoted prices for similar assets at the measurement
date; quoted prices in markets that are not active; or other inputs that are observable, either directly or indirectly.
These values were obtained from an independent pricing service and were evaluated using pricing models that
vary by asset class and may incorporate available trade, bid and other market information and price quotes from
well-established independent pricing vendors and broker-dealers. The Company’s procedures include controls to
ensure that appropriate fair values are recorded, such as comparing prices obtained from multiple independent
sources. See Note 5 to the consolidated financial statements for further information regarding the fair value of the
Company’s senior notes.
Because the Company does not intend to sell the investments that are in an unrealized loss position and it is
not likely that the Company will be required to sell any investments before recovery of their amortized cost basis,
the Company does not consider those investments with an unrealized loss to be other-than-temporarily impaired
at December 31, 2015. There were no material other-than-temporary impairments or credit losses related to
available-for-sale securities in the years ended December 31, 2015, 2014 or 2013.
There were no material gross realized gains or losses from the sale of available-for-sale investments in the
years ended December 31, 2015, 2014 and 2013. Realized gains and losses and interest income are included in
interest and other income.
The estimated fair value of short-term investments by contractual maturity as of December 31, 2015 is as
follows:
(in thousands)
Due within one year .............................................. $137,927
Due after one year and through 5 years ............................... 363,458
Total short-term investments ....................................... $501,385
55