NetFlix 2009 Annual Report Download - page 67
Download and view the complete annual report
Please find page 67 of the 2009 NetFlix annual report below. You can navigate through the pages in the report by either clicking on the pages listed below, or by using the keyword search tool below to find specific information within the annual report.-
 1
1 -
2
-
3
-
4
-
5
-
6
-
7
-
8
-
9
-
10
-
11
-
12
-
13
-
14
-
15
-
16
-
17
-
18
-
19
-
20
-
21
-
22
-
23
-
24
-
25
-
26
-
27
-
28
-
29
-
30
-
31
-
32
-
33
-
34
-
35
-
36
-
37
-
38
-
39
-
40
-
41
-
42
-
43
-
44
-
45
-
46
-
47
-
48
-
49
-
50
-
51
-
52
-
53
-
54
-
55
-
56
-
 57
57 -
 58
58 -
 59
59 -
 60
60 -
 61
61 -
 62
62 -
 63
63 -
 64
64 -
 65
65 -
 66
66 -
 67
67 -
 68
68 -
 69
69 -
 70
70 -
 71
71 -
 72
72 -
 73
73 -
 74
74 -
 75
75 -
 76
76 -
 77
77 -
78
-
79
-
80
-
81
-
82
-
83
-
84
-
85
-
86
-
87
-
88
 |
 |

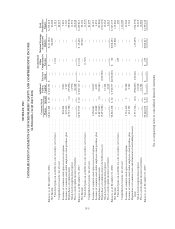
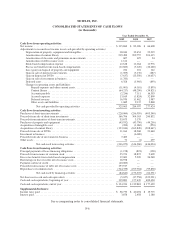
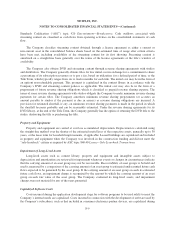
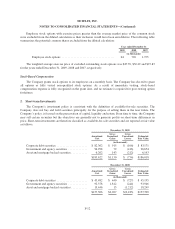
NETFLIX, INC.
NOTES TO CONSOLIDATED FINANCIAL STATEMENTS—(Continued)
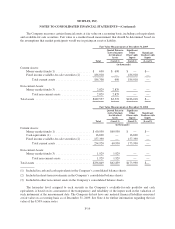
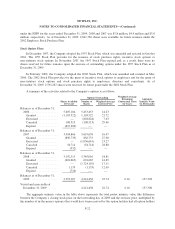
The Company measures certain financial assets at fair value on a recurring basis, including cash equivalents
and available-for-sale securities. Fair value is a market-based measurement that should be determined based on
the assumptions that market participants would use in pricing an asset or liability.
Fair Value Measurements at December 31, 2009
Quoted Prices in
Active Markets
for Identical
Assets
Significant
Other
Observable
Inputs
Significant
Unobservable
Inputs
Total (Level 1) (Level 2) (Level 3)
(in thousands)
Current Assets:
Money market funds (1) ....................... $ 690 $ 690 $ — $—
Fixed income available-for-sale securities (2) ...... 186,018 — 186,018 —
Total current assets ....................... 186,708 690 186,018 —
Non-current Assets:
Money market funds (3) ....................... 2,829 2,829 — —
Total non-current assets ................... 2,829 2,829 — —
Total assets ..................................... $189,537 $3,519 $186,018 $—
Fair Value Measurements at December 31, 2008
Quoted Prices in
Active Markets
for Identical
Assets
Significant
Other
Observable
Inputs
Significant
Unobservable
Inputs
Total (Level 1) (Level 2) (Level 3)
(in thousands)
Current Assets:
Money market funds (1) ....................... $ 60,930 $60,930 $ — $—
Cash equivalents (1) .......................... 16,600 — 16,600 —
Fixed income available-for-sale securities (2) ...... 157,390 — 157,390 —
Total current assets ....................... 234,920 60,930 173,990 —
Non-current Assets:
Money market funds (3) ....................... 1,929 1,929 — —
Total non-current assets ................... 1,929 1,929 — —
Total assets ..................................... $236,849 $62,859 $173,990 $—
(1) Included in cash and cash equivalents in the Company’s consolidated balance sheets.
(2) Included in short-term investments in the Company’s consolidated balance sheets.
(3) Included in other non-current assets in the Company’s consolidated balance sheets.
The hierarchy level assigned to each security in the Company’s available-for-sale portfolio and cash
equivalents is based on its assessment of the transparency and reliability of the inputs used in the valuation of
such instrument at the measurement date. The Company did not have any material financial liabilities measured
at fair value on a recurring basis as of December 31, 2009. See Note 4 for further information regarding the fair
value of the 8.50% senior notes.
F-14