NetFlix 2009 Annual Report Download - page 41
Download and view the complete annual report
Please find page 41 of the 2009 NetFlix annual report below. You can navigate through the pages in the report by either clicking on the pages listed below, or by using the keyword search tool below to find specific information within the annual report.-
 1
1 -
2
-
3
-
4
-
5
-
6
-
7
-
8
-
9
-
10
-
11
-
12
-
13
-
14
-
15
-
16
-
17
-
18
-
19
-
20
-
21
-
22
-
23
-
24
-
25
-
26
-
27
-
28
-
29
-
30
-
 31
31 -
 32
32 -
 33
33 -
 34
34 -
 35
35 -
 36
36 -
 37
37 -
 38
38 -
 39
39 -
 40
40 -
 41
41 -
 42
42 -
 43
43 -
 44
44 -
 45
45 -
 46
46 -
 47
47 -
 48
48 -
 49
49 -
 50
50 -
 51
51 -
52
-
53
-
54
-
55
-
56
-
57
-
58
-
59
-
60
-
61
-
62
-
63
-
64
-
65
-
66
-
67
-
68
-
69
-
70
-
71
-
72
-
73
-
74
-
75
-
76
-
77
-
78
-
79
-
80
-
81
-
82
-
83
-
84
-
85
-
86
-
87
-
88
 |
 |

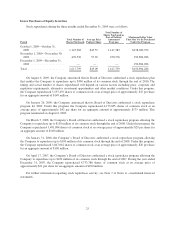
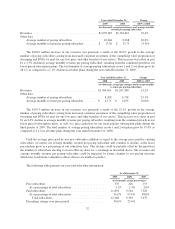
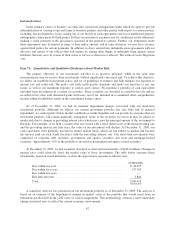
We expect to continue to make substantial investments in our content library and in particular may increase
spending associated with streaming content. These investments would reduce our gross margin to the extent that
increases outpace growth in our revenues.
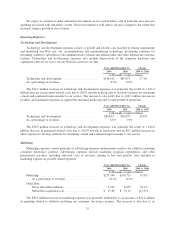
Operating Expenses
Technology and Development
Technology and development expenses consist of payroll and related costs incurred in testing, maintaining
and modifying our Web site, our recommendation and merchandising technology, developing solutions for
streaming content to subscribers, telecommunications systems and infrastructure and other internal-use software
systems. Technology and development expenses also include depreciation of the computer hardware and
capitalized software we use to run our Web site and store our data.
Year ended December 31, Change
2009 2008 2009 vs. 2008
(in thousands, except percentages)
Technology and development ......................... $114,542 $89,873 27.4%
As a percentage of revenues .......................... 6.9% 6.6%
The $24.7 million increase in technology and development expenses was primarily the result of a $17.4
million increase in personnel-related costs due to 26.6% growth in headcount to develop solutions for streaming
content and continued improvements to our service. The increase is also partly due to a $6.7 million increase in
facilities and equipment expenses to support the increased headcount and overall growth of operations.
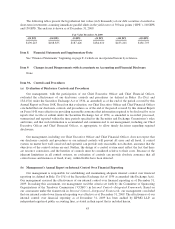
Year ended December 31, Change
2008 2007 2008 vs. 2007
(in thousands, except percentages)
Technology and development ......................... $89,873 $70,979 26.6%
As a percentage of revenues .......................... 6.6% 5.9%
The $18.9 million increase in technology and development expenses was primarily the result of a $10.4
million increase in personnel-related costs due to 28.0% growth in headcount and an $8.5 million increase in
other expenses to develop solutions for streaming content and continued improvements to our service.
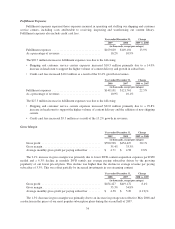
Marketing
Marketing expenses consist primarily of advertising expenses and payments made to our affiliates including
consumer electronics partners. Advertising expenses include marketing program expenditures and other
promotional activities, including allocated costs of revenues relating to free trial periods. Also included in
marketing expense are payroll related expenses.
Year ended December 31, Change
2009 2008 2009 vs. 2008
(in thousands, except percentages)
Marketing ........................................ $237,744 $199,713 19.0%
As a percentage of revenues ...................... 14.2% 14.6%
Other Data:
Gross subscriber additions ....................... 9,332 6,859 36.1%
Subscriber acquisition cost ....................... $ 25.48 $ 29.12 (12.5)%
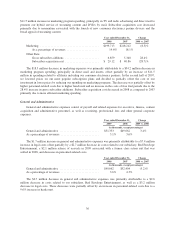
The $38.0 million increase in marketing expenses was primarily attributable to an increase of $21.4 million
in spending related to affiliates including our consumer electronics partners. The increase is also due to an
35