NetFlix 2009 Annual Report Download - page 66
Download and view the complete annual report
Please find page 66 of the 2009 NetFlix annual report below. You can navigate through the pages in the report by either clicking on the pages listed below, or by using the keyword search tool below to find specific information within the annual report.-
 1
1 -
2
-
3
-
4
-
5
-
6
-
7
-
8
-
9
-
10
-
11
-
12
-
13
-
14
-
15
-
16
-
17
-
18
-
19
-
20
-
21
-
22
-
23
-
24
-
25
-
26
-
27
-
28
-
29
-
30
-
31
-
32
-
33
-
34
-
35
-
36
-
37
-
38
-
39
-
40
-
41
-
42
-
43
-
44
-
45
-
46
-
47
-
48
-
49
-
50
-
51
-
52
-
53
-
54
-
55
-
 56
56 -
 57
57 -
 58
58 -
 59
59 -
 60
60 -
 61
61 -
 62
62 -
 63
63 -
 64
64 -
 65
65 -
 66
66 -
 67
67 -
 68
68 -
 69
69 -
 70
70 -
 71
71 -
 72
72 -
 73
73 -
 74
74 -
 75
75 -
 76
76 -
77
-
78
-
79
-
80
-
81
-
82
-
83
-
84
-
85
-
86
-
87
-
88
 |
 |

NETFLIX, INC.
NOTES TO CONSOLIDATED FINANCIAL STATEMENTS—(Continued)
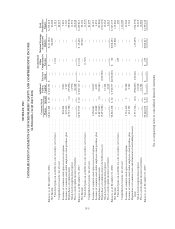
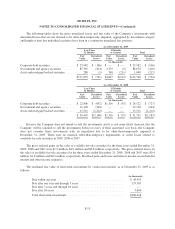
The following tables show the gross unrealized losses and fair value of the Company’s investments with
unrealized losses that are not deemed to be other-than-temporarily impaired, aggregated by investment category
and length of time that individual securities have been in a continuous unrealized loss position:
As of December 31, 2009
Less Than
12 Months
12 Months
or Greater Total
Fair
Value
Unrealized
Losses
Fair
Value
Unrealized
Losses
Fair
Value
Unrealized
Losses
(in thousands)
Corporate debt securities ................ $ 25,982 $ (106) $ — $ — $ 25,982 $ (106)
Government and agency securities ........ 85,391 (414) 3,279 (2) 88,670 (416)
Asset and mortgage backed securities ...... 280 (1) 768 (211) 1,048 (212)
$111,653 $ (521) $4,047 $(213) $115,700 $ (734)
As of December 31, 2008
Less Than
12 Months
12 Months
or Greater Total
Fair
Value
Unrealized
Losses
Fair
Value
Unrealized
Losses
Fair
Value
Unrealized
Losses
(in thousands)
Corporate debt securities ................ $ 22,806 $ (692) $1,316 $ (35) $ 24,122 $ (727)
Government and agency securities ........ 12,128 (244) — — 12,128 (244)
Asset and mortgage backed securities ...... 15,511 (1,212) — — 15,511 (1,212)
$ 50,445 $(2,148) $1,316 $ (35) $ 51,761 $(2,183)
Because the Company does not intend to sell the investments and it is not more likely than not that the
Company will be required to sell the investments before recovery of their amortized cost basis, the Company
does not consider those investments with an unrealized loss to be other-than-temporarily impaired at
December 31, 2009. There were no material other-than-temporary impairments or credit losses related to
available-for-sale securities in 2009, 2008 or 2007.
The gross realized gains on the sales of available-for-sale securities for the three years ended December 31,
2009, 2008 and 2007 were $1.9 million, $4.9 million and $0.8 million, respectively. The gross realized losses on
the sales of available-for-sale securities for the three years ended December 31, 2009, 2008 and 2007 were $0.4
million, $1.8 million and $0.1 million, respectively. Realized gains and losses and interest income are included in
interest and other income (expense).
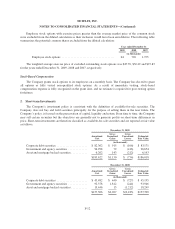
The estimated fair value of short-term investments by contractual maturity as of December 31, 2009 is as
follows:
(in thousands)
Due within one year .............................................. $ 44,455
Due after one year and through 5 years ............................... 137,763
Due after 5 years and through 10 years ............................... —
Due after 10 years ............................................... 3,800
Total short-term investments ....................................... $186,018
F-13