NetFlix 2009 Annual Report Download - page 57
Download and view the complete annual report
Please find page 57 of the 2009 NetFlix annual report below. You can navigate through the pages in the report by either clicking on the pages listed below, or by using the keyword search tool below to find specific information within the annual report.-
 1
1 -
2
-
3
-
4
-
5
-
6
-
7
-
8
-
9
-
10
-
11
-
12
-
13
-
14
-
15
-
16
-
17
-
18
-
19
-
20
-
21
-
22
-
23
-
24
-
25
-
26
-
27
-
28
-
29
-
30
-
31
-
32
-
33
-
34
-
35
-
36
-
37
-
38
-
39
-
40
-
41
-
42
-
43
-
44
-
45
-
46
-
 47
47 -
 48
48 -
 49
49 -
 50
50 -
 51
51 -
 52
52 -
 53
53 -
 54
54 -
 55
55 -
 56
56 -
 57
57 -
 58
58 -
 59
59 -
 60
60 -
 61
61 -
 62
62 -
 63
63 -
 64
64 -
 65
65 -
 66
66 -
 67
67 -
68
-
69
-
70
-
71
-
72
-
73
-
74
-
75
-
76
-
77
-
78
-
79
-
80
-
81
-
82
-
83
-
84
-
85
-
86
-
87
-
88
 |
 |

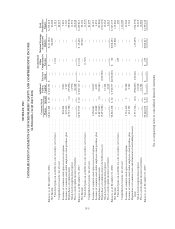
NETFLIX, INC.
CONSOLIDATED STATEMENTS OF OPERATIONS
(in thousands, except per share data)
Year ended December 31,
2009 2008 2007
Revenues .................................................. $1,670,269 $1,364,661 $1,205,340
Cost of revenues:
Subscription ............................................ 909,461 761,133 664,407
Fulfillment expenses* .................................... 169,810 149,101 121,761
Total cost of revenues ................................ 1,079,271 910,234 786,168
Gross Profit ................................................ 590,998 454,427 419,172
Operating expenses:
Technology and development* ............................. 114,542 89,873 70,979
Marketing* ............................................ 237,744 199,713 218,212
General and administrative* ............................... 51,333 49,662 52,404
Gain on disposal of DVDs ................................ (4,560) (6,327) (7,196)
Gain on legal settlement .................................. — — (7,000)
Total operating expenses .............................. 399,059 332,921 327,399
Operating income ........................................... 191,939 121,506 91,773
Other income (expense):
Interest expense ......................................... (6,475) (2,458) (1,188)
Interest and other income (expense) ......................... 6,728 12,452 20,340
Income before income taxes ................................... 192,192 131,500 110,925
Provision for income taxes .................................... 76,332 48,474 44,317
Net income ................................................ $ 115,860 $ 83,026 $ 66,608
Net income per share:
Basic ................................................. $ 2.05 $ 1.36 $ 0.99
Diluted ................................................ $ 1.98 $ 1.32 $ 0.97
Weighted-average common shares outstanding:
Basic ................................................. 56,560 60,961 67,076
Diluted ................................................ 58,416 62,836 68,902
* Stock-based compensation included in expense line items:
Fulfillment expenses ..................................... $ 380 $ 466 $ 427
Technology and development .............................. 4,453 3,890 3,695
Marketing ............................................. 1,786 1,886 2,160
General and administrative ................................ 5,999 6,022 5,694
See accompanying notes to consolidated financial statements.
F-4