NetFlix 2009 Annual Report Download - page 46
Download and view the complete annual report
Please find page 46 of the 2009 NetFlix annual report below. You can navigate through the pages in the report by either clicking on the pages listed below, or by using the keyword search tool below to find specific information within the annual report.-
 1
1 -
2
-
3
-
4
-
5
-
6
-
7
-
8
-
9
-
10
-
11
-
12
-
13
-
14
-
15
-
16
-
17
-
18
-
19
-
20
-
21
-
22
-
23
-
24
-
25
-
26
-
27
-
28
-
29
-
30
-
31
-
32
-
33
-
34
-
35
-
 36
36 -
 37
37 -
 38
38 -
 39
39 -
 40
40 -
 41
41 -
 42
42 -
 43
43 -
 44
44 -
 45
45 -
 46
46 -
 47
47 -
 48
48 -
 49
49 -
 50
50 -
 51
51 -
 52
52 -
 53
53 -
 54
54 -
 55
55 -
 56
56 -
57
-
58
-
59
-
60
-
61
-
62
-
63
-
64
-
65
-
66
-
67
-
68
-
69
-
70
-
71
-
72
-
73
-
74
-
75
-
76
-
77
-
78
-
79
-
80
-
81
-
82
-
83
-
84
-
85
-
86
-
87
-
88
 |
 |

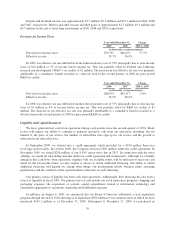
additional $62.4 million of our common stock under the program. The timing and actual number of shares
repurchased will depend on various factors including price, corporate and regulatory requirements, alternative
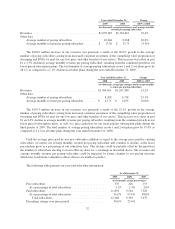
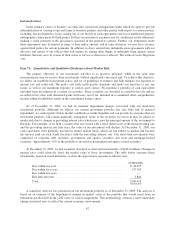
investment opportunities and other market conditions. The following table highlights selected measures of our
liquidity and capital resources as of December 31, 2009, 2008 and 2007:
Year Ended December 31,
2009 2008 2007
(in thousands)
Cash and cash equivalents ............................ $134,224 $ 139,881 $ 177,439
Short-term investments .............................. 186,018 157,390 207,703
$ 320,242 $ 297,271 $ 385,142
Net cash provided by operating activities ................ $325,063 $ 284,037 $ 277,424
Net cash used in investing activities .................... $(246,079) $(144,960) $(436,024)
Net cash used in financing activities .................... $ (84,641) $(176,635) $ (64,391)
Operating Activities
During 2009, our operating activities consisted primarily of net income of $115.9 million, increased by
non-cash adjustments of $254.9 million and offset by a decrease in net changes in operating assets and liabilities
of $45.7 million. The majority of the non-cash adjustments came from the amortization of the content library of
$219.5 million which increased by $9.7 million over the prior period as we continue to purchase additional titles
in order to support our larger subscriber base. The decrease in cash flow attributable to the net changes in
operating assets and liabilities was mainly driven by acquisitions of content library related to our streaming
content, as we continued to increase our investments in streaming content in 2009. Cash provided by operating
activities increased $41.0 million in 2009 as compared to 2008. This was primarily due to an increase in net
income of $32.8 million, increased non-cash adjustments of $27.3 million and a decrease in net changes in
operating assets and liabilities of $19.1 million.
During 2008, our operating activities consisted primarily of net income of $83.0 million, increased by
non-cash adjustments of $227.6 million offset by a decrease in net changes in operating assets and liabilities of
$26.6 million. The majority of the non-cash adjustments came from the amortization of the content library of
$209.8 million which increased by $6.3 million over the prior period as we continue to purchase additional titles
in order to support our larger subscriber base. The decrease in net changes in operating assets and liabilities was
mainly driven by acquisitions of content library related to our streaming content, as we continued to increase our
investments in streaming content in 2008. Cash provided by operating activities increased $6.6 million in 2008 as
compared to 2007. This was primarily due to an increase in net income of $16.4 million, increased non-cash
adjustments of $32.3 million and a decrease in net changes in operating assets and liabilities of $42.1 million.
Investing Activities
Our investing activities consisted primarily of purchases, sales and maturities of available-for-sale
securities, acquisitions of DVD content library and purchases of property and equipment. Cash used in investing
activities increased $101.1 million in 2009 as compared to 2008. This increase was primarily driven by a
decrease in the proceeds from the sales and maturities of short-term investments of $105.0 million offset partially
by a decrease in the purchases of short term investments of $29.0 million. In addition, acquisitions of DVDs
increased by $30.2 million.
Cash used in investing activities decreased $291.1 million in 2008 as compared to 2007. This decrease was
primarily driven by a decrease in the purchases of short-term investments of $148.4 million coupled with an
increase in the proceeds from the sales and maturities of short-term investments of $106.5 million. In addition,
acquisitions of DVDs decreased by $45.8 million as more DVDs were obtained through revenue sharing
agreements in 2008.
40