NetFlix 2009 Annual Report Download - page 32
Download and view the complete annual report
Please find page 32 of the 2009 NetFlix annual report below. You can navigate through the pages in the report by either clicking on the pages listed below, or by using the keyword search tool below to find specific information within the annual report.-
 1
1 -
2
-
3
-
4
-
5
-
6
-
7
-
8
-
9
-
10
-
11
-
12
-
13
-
14
-
15
-
16
-
17
-
18
-
19
-
20
-
21
-
 22
22 -
 23
23 -
 24
24 -
 25
25 -
 26
26 -
 27
27 -
 28
28 -
 29
29 -
 30
30 -
 31
31 -
 32
32 -
 33
33 -
 34
34 -
 35
35 -
 36
36 -
 37
37 -
 38
38 -
 39
39 -
 40
40 -
 41
41 -
 42
42 -
43
-
44
-
45
-
46
-
47
-
48
-
49
-
50
-
51
-
52
-
53
-
54
-
55
-
56
-
57
-
58
-
59
-
60
-
61
-
62
-
63
-
64
-
65
-
66
-
67
-
68
-
69
-
70
-
71
-
72
-
73
-
74
-
75
-
76
-
77
-
78
-
79
-
80
-
81
-
82
-
83
-
84
-
85
-
86
-
87
-
88
 |
 |

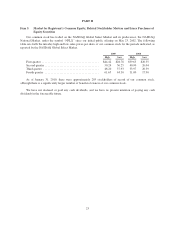
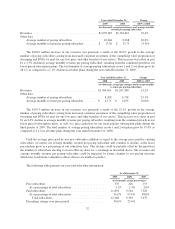
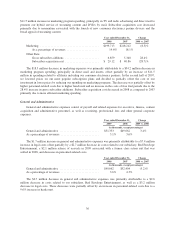
Item 6. Selected Financial Data
The following selected financial data is not necessarily indicative of results of future operations and should
be read in conjunction with “Item 7, Management’s Discussion and Analysis of Financial Condition and Results
of Operations” and “Item 8, Financial Statements and Supplementary Data .”
Year ended December 31,
2009 2008 2007 (1) 2006 2005 (2)
(in thousands, except per share data)
Revenues ............................... $1,670,269 $1,364,661 $1,205,340 $996,660 $682,213
Total cost of revenues ..................... 1,079,271 910,234 786,168 626,985 465,775
Operating income ........................ 191,939 121,506 91,773 65,218 2,622
Net income ............................. 115,860 83,026 66,608 48,839 41,889
Net income per share:
Basic .............................. $ 2.05 $ 1.36 $ 0.99 $ 0.78 $ 0.78
Diluted ............................. $ 1.98 $ 1.32 $ 0.97 $ 0.71 $ 0.64
Weighted-average shares outstanding:
Basic .............................. 56,560 60,961 67,076 62,577 53,528
Diluted ............................. 58,416 62,836 68,902 69,075 65,518
Notes:
(1) Operating expenses for the year includes a one-time payment received in the amount of $7.0 million as a
result of resolving a patent litigation with Blockbuster, Inc.
(2) Net income for the year includes a benefit of realized deferred tax assets of $34.9 million or approximately
$0.53 per diluted share, related to the recognition of the Company’s deferred tax assets. In addition, general
and administrative expenses includes an accrual of $8.1 million (net of expected insurance proceeds for
reimbursement of legal defense costs of $0.9 million) related to the settlement costs of a class action
lawsuit.
As of December 31,
2009 2008 (5) 2007 2006 2005
(in thousands)
Balance Sheet Data:
Cash and cash equivalents ......... $134,224 $139,881 $177,439 $400,430 $212,256
Short-term investments (3) ......... 186,018 157,390 207,703 — —
Working capital ................. 184,644 142,908 223,518 234,582 105,776
Total assets ..................... 679,734 615,424 678,998 633,013 385,114
Long-term debt .................. 200,000 ————
Lease financing obligations,
excluding current portion ........ 36,572 37,988 35,652 23,798 19,876
Other non-current liabilities ........ 17,650 14,264 4,629 1,761 1,421
Stockholders’ equity .............. 199,143 347,155 429,812 413,618 225,902
As of / Year Ended December 31,
2009 2008 2007 2006 2005
(in thousands, except subscriber acquisition cost)
Other Data:
Total subscribers at end of period . . . 12,268 9,390 7,479 6,316 4,179
Gross subscriber additions during
period ....................... 9,332 6,859 5,340 5,250 3,729
Subscriber acquisition cost (4) ...... $ 25.48 $29.12 $40.86 $42.94 $38.78
(3) Short-term investments are comprised of corporate debt securities, government and agency securities and
asset and mortgage-backed securities.
26