NetFlix 2009 Annual Report Download - page 59
Download and view the complete annual report
Please find page 59 of the 2009 NetFlix annual report below. You can navigate through the pages in the report by either clicking on the pages listed below, or by using the keyword search tool below to find specific information within the annual report.-
 1
1 -
2
-
3
-
4
-
5
-
6
-
7
-
8
-
9
-
10
-
11
-
12
-
13
-
14
-
15
-
16
-
17
-
18
-
19
-
20
-
21
-
22
-
23
-
24
-
25
-
26
-
27
-
28
-
29
-
30
-
31
-
32
-
33
-
34
-
35
-
36
-
37
-
38
-
39
-
40
-
41
-
42
-
43
-
44
-
45
-
46
-
47
-
48
-
 49
49 -
 50
50 -
 51
51 -
 52
52 -
 53
53 -
 54
54 -
 55
55 -
 56
56 -
 57
57 -
 58
58 -
 59
59 -
 60
60 -
 61
61 -
 62
62 -
 63
63 -
 64
64 -
 65
65 -
 66
66 -
 67
67 -
 68
68 -
 69
69 -
70
-
71
-
72
-
73
-
74
-
75
-
76
-
77
-
78
-
79
-
80
-
81
-
82
-
83
-
84
-
85
-
86
-
87
-
88
 |
 |

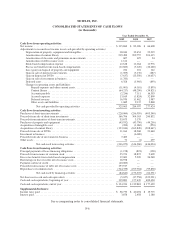
NETFLIX, INC.
CONSOLIDATED STATEMENTS OF CASH FLOWS
(in thousands)
Year Ended December 31,
2009 2008 2007
Cash flows from operating activities:
Net income ............................................................ $115,860 $ 83,026 $ 66,608
Adjustments to reconcile net income to net cash provided by operating activities:
Depreciation of property, equipment and intangibles ........................ 38,044 32,454 22,219
Amortization of content library ......................................... 219,490 209,757 203,415
Amortization of discounts and premiums on investments .................... 607 625 24
Amortization of debt issuance costs ..................................... 1,124 — —
Stock-based compensation expense ..................................... 12,618 12,264 11,976
Excess tax benefits from stock-based compensation ........................ (12,683) (5,220) (26,248)
Loss (gain) on disposal of property and equipment ......................... 254 101 142
Gain on sale of short-term investments ................................... (1,509) (3,130) (687)
Gain on disposal of DVDs ............................................ (7,637) (13,350) (14,637)
Gain on sale of investment in business ................................... (1,783) — —
Deferred taxes ...................................................... 6,328 (5,905) (893)
Changes in operating assets and liabilities:
Prepaid expenses and other current assets ............................. (11,001) (4,181) (3,893)
Content library .................................................. (64,217) (48,290) (34,821)
Accounts payable ............................................... (2,256) 7,111 16,555
Accrued expenses ............................................... 13,169 (1,824) 32,809
Deferred revenue ................................................ 16,970 11,462 1,987
Other assets and liabilities ......................................... 1,685 9,137 2,868
Net cash provided by operating activities ......................... 325,063 284,037 277,424
Cash flows from investing activities:
Purchases of short-term investments ......................................... (228,000) (256,959) (405,340)
Proceeds from sale of short-term investments ................................. 166,706 304,163 200,832
Proceeds from maturities of short-term investments ............................. 35,673 3,170 —
Purchases of property and equipment ........................................ (45,932) (43,790) (44,256)
Acquisition of intangible asset ............................................. (200) (1,062) (550)
Acquisitions of content library ............................................. (193,044) (162,849) (208,647)
Proceeds from sale of DVDs ............................................... 11,164 18,368 21,640
Investment in business ................................................... — (6,000) —
Proceeds from sale of investment in business .................................. 7,483 — —
Other assets ............................................................ 71 (1) 297
Net cash used in investing activities ............................. (246,079) (144,960) (436,024)
Cash flows from financing activities:
Principal payments of lease financing obligations .............................. (1,158) (823) (390)
Proceeds from issuance of common stock .................................... 35,274 18,872 9,609
Excess tax benefits from stock-based compensation ............................ 12,683 5,220 26,248
Borrowings on line of credit, net of issuance costs .............................. 18,978 — —
Payments on line of credit ................................................. (20,000) — —
Proceeds from issuance of debt, net of issuance costs ........................... 193,917 — —
Repurchases of common stock ............................................. (324,335) (199,904) (99,858)
Net cash used by financing activities ............................ (84,641) (176,635) (64,391)
Net decrease in cash and cash equivalents .................................... (5,657) (37,558) (222,991)
Cash and cash equivalents, beginning of year .................................. 139,881 177,439 400,430
Cash and cash equivalents, end of year ....................................... $134,224 $ 139,881 $ 177,439
Supplemental disclosure:
Income taxes paid ....................................................... $ 58,770 $ 40,494 $ 15,775
Interest paid ............................................................ 3,878 2,458 1,188
See accompanying notes to consolidated financial statements.
F-6