NetFlix 2009 Annual Report Download - page 40
Download and view the complete annual report
Please find page 40 of the 2009 NetFlix annual report below. You can navigate through the pages in the report by either clicking on the pages listed below, or by using the keyword search tool below to find specific information within the annual report.-
 1
1 -
2
-
3
-
4
-
5
-
6
-
7
-
8
-
9
-
10
-
11
-
12
-
13
-
14
-
15
-
16
-
17
-
18
-
19
-
20
-
21
-
22
-
23
-
24
-
25
-
26
-
27
-
28
-
29
-
 30
30 -
 31
31 -
 32
32 -
 33
33 -
 34
34 -
 35
35 -
 36
36 -
 37
37 -
 38
38 -
 39
39 -
 40
40 -
 41
41 -
 42
42 -
 43
43 -
 44
44 -
 45
45 -
 46
46 -
 47
47 -
 48
48 -
 49
49 -
 50
50 -
51
-
52
-
53
-
54
-
55
-
56
-
57
-
58
-
59
-
60
-
61
-
62
-
63
-
64
-
65
-
66
-
67
-
68
-
69
-
70
-
71
-
72
-
73
-
74
-
75
-
76
-
77
-
78
-
79
-
80
-
81
-
82
-
83
-
84
-
85
-
86
-
87
-
88
 |
 |

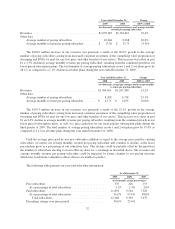
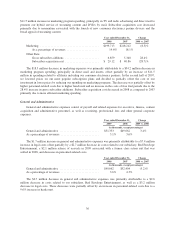
Fulfillment Expenses
Fulfillment expenses represent those expenses incurred in operating and staffing our shipping and customer
service centers, including costs attributable to receiving, inspecting and warehousing our content library.
Fulfillment expenses also include credit card fees.
Year ended December 31, Change
2009 2008 2009 vs. 2008
(in thousands, except percentages)
Fulfillment expenses ................................. $169,810 $149,101 13.9%
As a percentage of revenues ........................... 10.2% 10.9%
The $20.7 million increase in fulfillment expenses was due to the following:
• Shipping and customer service centers expenses increased $10.5 million primarily due to a 14.0%
increase in headcount to support the higher volume of content delivery and growth in subscribers.
• Credit card fees increased $10.2 million as a result of the 22.4% growth in revenues.
Year ended December 31, Change
2008 2007 2008 vs. 2007
(in thousands, except percentages)
Fulfillment expenses ................................. $149,101 $121,761 22.5%
As a percentage of revenues ........................... 10.9% 10.1%
The $27.3 million increase in fulfillment expenses was due to the following:
• Shipping and customer service centers expenses increased $22.0 million primarily due to a 29.8%
increase in headcount to support the higher volume of content delivery and the addition of new shipping
centers.
• Credit card fees increased $5.3 million as a result of the 13.2% growth in revenues.
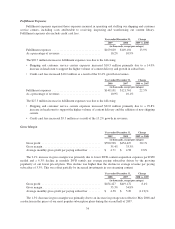
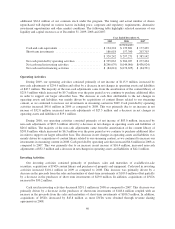
Gross Margin
Year ended December 31, Change
2009 2008 2009 vs. 2008
(in thousands, except percentages)
Gross profit ........................................ $590,998 $454,427 30.1%
Gross margin ....................................... 35.4% 33.3%
Average monthly gross profit per paying subscriber ........ $ 4.71 $ 4.58 2.8%
The 2.1% increase in gross margin was primarily due to lower DVD content acquisition expenses per DVD
mailed and a 6.3% decline in monthly DVD rentals per average paying subscriber driven by the growing
popularity of our lower priced plans. This decline was higher than the decline in average revenue per paying
subscriber of 3.3%. This was offset partially by increased investments in our streaming content.
Year ended December 31, Change
2008 2007 2008 vs. 2007
(in thousands, except percentages)
Gross profit ........................................ $454,427 $419,172 8.4%
Gross margin ....................................... 33.3% 34.8%
Average monthly gross profit per paying subscriber ........ $ 4.58 $ 5.20 (11.9)%
The 1.5% decrease in gross margin was primarily due to an increase in postage rates effective May 2008 and
a reduction in the prices of our most popular subscription plans during the second half of 2007.
34