Macy's 2014 Annual Report Download - page 91
Download and view the complete annual report
Please find page 91 of the 2014 Macy's annual report below. You can navigate through the pages in the report by either clicking on the pages listed below, or by using the keyword search tool below to find specific information within the annual report.-
 1
1 -
2
-
3
-
4
-
5
-
6
-
7
-
8
-
9
-
10
-
11
-
12
-
13
-
14
-
15
-
16
-
17
-
18
-
19
-
20
-
21
-
22
-
23
-
24
-
25
-
26
-
27
-
28
-
29
-
30
-
31
-
32
-
33
-
34
-
35
-
36
-
37
-
38
-
39
-
40
-
41
-
42
-
43
-
44
-
45
-
46
-
47
-
48
-
49
-
50
-
51
-
52
-
53
-
54
-
55
-
56
-
57
-
58
-
59
-
60
-
61
-
62
-
63
-
64
-
65
-
66
-
67
-
68
-
69
-
70
-
71
-
72
-
73
-
74
-
75
-
76
-
77
-
78
-
79
-
80
-
 81
81 -
 82
82 -
 83
83 -
 84
84 -
 85
85 -
 86
86 -
 87
87 -
 88
88 -
 89
89 -
 90
90 -
 91
91 -
 92
92 -
 93
93 -
 94
94 -
 95
95 -
 96
96 -
 97
97 -
 98
98 -
 99
99 -
 100
100 -
 101
101 -
102
-
103
-
104
 |
 |

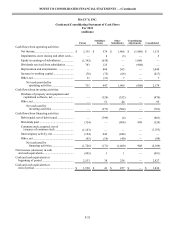
NOTES TO CONSOLIDATED FINANCIAL STATEMENTS — (Continued)
F-44
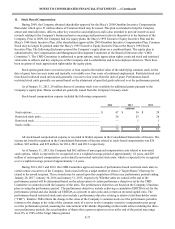
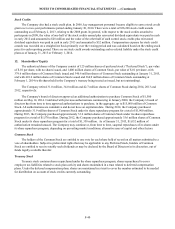
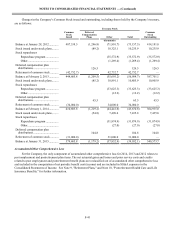
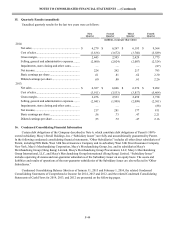
15. Quarterly Results (unaudited)
Unaudited quarterly results for the last two years were as follows:
First
Quarter Second
Quarter Third
Quarter Fourth
Quarter
(millions, except per share data)
2014:
Net sales................................................................. $ 6,279 $ 6,267 $ 6,195 $ 9,364
Cost of sales........................................................... (3,836)(3,672)(3,766)(5,589)
Gross margin.......................................................... 2,443 2,595 2,429 3,775
Selling, general and administrative expenses........ (2,000)(2,024)(2,007)(2,324)
Impairments, store closing and other costs............ ———(87)
Net income............................................................. 224 292 217 793
Basic earnings per share........................................ .61 .81 .62 2.30
Diluted earnings per share..................................... .60 .80 .61 2.26
2013:
Net sales................................................................. $ 6,387 $ 6,066 $ 6,276 $ 9,202
Cost of sales........................................................... (3,911)(3,533)(3,817)(5,464)
Gross margin.......................................................... 2,476 2,533 2,459 3,738
Selling, general and administrative expenses........ (2,041)(1,999)(2,099)(2,301)
Impairments, store closing and other costs............ ———(88)
Net income............................................................. 217 281 177 811
Basic earnings per share........................................ .56 .73 .47 2.21
Diluted earnings per share..................................... .55 .72 .47 2.16
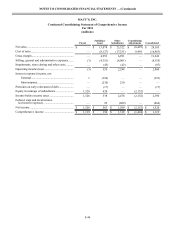
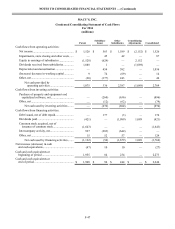
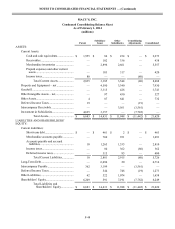
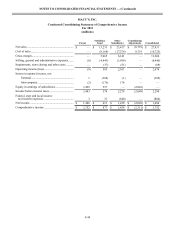
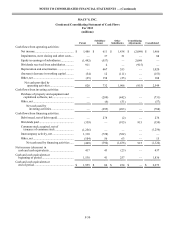
16. Condensed Consolidating Financial Information
Certain debt obligations of the Company described in Note 6, which constitute debt obligations of Parent’s 100%-
owned subsidiary, Macy’s Retail Holdings, Inc. (“Subsidiary Issuer”) are fully and unconditionally guaranteed by Parent.
In the following condensed consolidating financial statements, “Other Subsidiaries” includes all other direct subsidiaries of
Parent, including FDS Bank, West 34th Street Insurance Company and its subsidiary West 34th Street Insurance Company
New York, Macy's Merchandising Corporation, Macy’s Merchandising Group, Inc. and its subsidiaries Macy's
Merchandising Group (Hong Kong) Limited, Macy's Merchandising Group Procurement, LLC, Macy’s Merchandising
Group International, LLC, and Macy's Merchandising Group International (Hong Kong) Limited. “Subsidiary Issuer”
includes operating divisions and non-guarantor subsidiaries of the Subsidiary Issuer on an equity basis. The assets and
liabilities and results of operations of the non-guarantor subsidiaries of the Subsidiary Issuer are also reflected in “Other
Subsidiaries.”
Condensed Consolidating Balance Sheets as of January 31, 2015 and February 1, 2014, the related Condensed
Consolidating Statements of Comprehensive Income for 2014, 2013 and 2012, and the related Condensed Consolidating
Statements of Cash Flows for 2014, 2013, and 2012 are presented on the following pages.