Macy's 2014 Annual Report Download - page 14
Download and view the complete annual report
Please find page 14 of the 2014 Macy's annual report below. You can navigate through the pages in the report by either clicking on the pages listed below, or by using the keyword search tool below to find specific information within the annual report.-
 1
1 -
2
-
3
-
 4
4 -
 5
5 -
 6
6 -
 7
7 -
 8
8 -
 9
9 -
 10
10 -
 11
11 -
 12
12 -
 13
13 -
 14
14 -
 15
15 -
 16
16 -
 17
17 -
 18
18 -
 19
19 -
 20
20 -
 21
21 -
 22
22 -
 23
23 -
 24
24 -
25
-
26
-
27
-
28
-
29
-
30
-
31
-
32
-
33
-
34
-
35
-
36
-
37
-
38
-
39
-
40
-
41
-
42
-
43
-
44
-
45
-
46
-
47
-
48
-
49
-
50
-
51
-
52
-
53
-
54
-
55
-
56
-
57
-
58
-
59
-
60
-
61
-
62
-
63
-
64
-
65
-
66
-
67
-
68
-
69
-
70
-
71
-
72
-
73
-
74
-
75
-
76
-
77
-
78
-
79
-
80
-
81
-
82
-
83
-
84
-
85
-
86
-
87
-
88
-
89
-
90
-
91
-
92
-
93
-
94
-
95
-
96
-
97
-
98
-
99
-
100
-
101
-
102
-
103
-
104
 |
 |

9
Factors beyond the Company’s control could affect the Company’s stock price.
The Company’s stock price, like that of other retail companies, is subject to significant volatility because of many
factors, including factors beyond the control of the Company. These factors may include:
• general economic and stock and credit market conditions;
• risks relating to the Company’s business and its industry, including those discussed above;
• strategic actions by the Company or its competitors;
• variations in the Company’s quarterly results of operations;
• future sales or purchases of the Company’s common stock; and
• investor perceptions of the investment opportunity associated with the Company’s common stock relative
to other investment alternatives.
In addition, the Company may fail to meet the expectations of its stockholders or of analysts at some time in the
future. If the analysts that regularly follow the Company’s stock lower their rating or lower their projections for future
growth and financial performance, the Company’s stock price could decline. Also, sales of a substantial number of shares
of the Company’s common stock in the public market or the appearance that these shares are available for sale could
adversely affect the market price of the Company’s common stock.
Item 1B. Unresolved Staff Comments.
None.
Item 2. Properties.
The properties of the Company consist primarily of stores and related facilities, including a logistics network. The
Company also owns or leases other properties, including corporate office space in Cincinnati and New York and other
facilities at which centralized operational support functions are conducted. As of January 31, 2015, the operations of the
Company included 823 stores in 45 states, the District of Columbia, Puerto Rico and Guam, comprising a total of
approximately 147,400,000 square feet. Of such stores, 447 were owned, 267 were leased and 109 stores were operated
under arrangements where the Company owned the building and leased the land. All owned properties are held free and
clear of mortgages. Pursuant to various shopping center agreements, the Company is obligated to operate certain stores for
periods of up to 20 years. Some of these agreements require that the stores be operated under a particular name. Most
leases require the Company to pay real estate taxes, maintenance and other costs; some also require additional payments
based on percentages of sales and some contain purchase options. Certain of the Company’s real estate leases have terms
that extend for a significant number of years and provide for rental rates that increase or decrease over time.
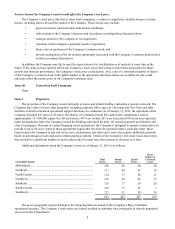
Additional information about the Company’s stores as of January 31, 2015 is as follows:
Geographic Region Total
Stores Owned
Stores Leased
Stores
Stores
Subject to
a Ground
Lease
Mid-Atlantic.................................................................................... 126 66 40 20
Northeast......................................................................................... 117 60 47 10
North Central................................................................................... 114 77 26 11
Northwest........................................................................................ 118 39 62 17
Southeast......................................................................................... 116 77 19 20
South Central................................................................................... 107 77 23 7
Southwest........................................................................................ 125 51 50 24
823 447 267 109
The seven geographic regions detailed in the foregoing table are based on the Company’s Macy’s-branded
operational structure. The Company’s retail stores are located at urban or suburban sites, principally in densely populated
areas across the United States.