Macy's 2014 Annual Report Download - page 21
Download and view the complete annual report
Please find page 21 of the 2014 Macy's annual report below. You can navigate through the pages in the report by either clicking on the pages listed below, or by using the keyword search tool below to find specific information within the annual report.-
 1
1 -
2
-
3
-
4
-
5
-
6
-
7
-
8
-
9
-
10
-
 11
11 -
 12
12 -
 13
13 -
 14
14 -
 15
15 -
 16
16 -
 17
17 -
 18
18 -
 19
19 -
 20
20 -
 21
21 -
 22
22 -
 23
23 -
 24
24 -
 25
25 -
 26
26 -
 27
27 -
 28
28 -
 29
29 -
 30
30 -
 31
31 -
32
-
33
-
34
-
35
-
36
-
37
-
38
-
39
-
40
-
41
-
42
-
43
-
44
-
45
-
46
-
47
-
48
-
49
-
50
-
51
-
52
-
53
-
54
-
55
-
56
-
57
-
58
-
59
-
60
-
61
-
62
-
63
-
64
-
65
-
66
-
67
-
68
-
69
-
70
-
71
-
72
-
73
-
74
-
75
-
76
-
77
-
78
-
79
-
80
-
81
-
82
-
83
-
84
-
85
-
86
-
87
-
88
-
89
-
90
-
91
-
92
-
93
-
94
-
95
-
96
-
97
-
98
-
99
-
100
-
101
-
102
-
103
-
104
 |
 |
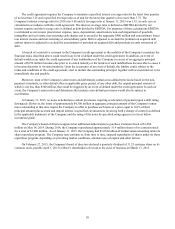
16
2014 Highlights
The Company had its sixth consecutive year of improved financial performance in 2014 and attained its long-term
profitability target. These improvements have been driven by successful implementation of the Company's key strategies.
Selected highlights of 2014 include:
• Comparable sales on an owned basis increased 0.7% and comparable sales on an owned plus licensed basis
increased 1.4%. These measures represent the fifth consecutive year of growth.
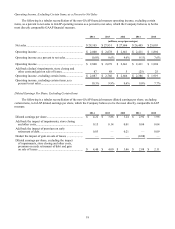
• Operating income for fiscal 2014 was $2.887 billion or 10.3% of sales, excluding impairments, store closing and
other costs, an increase of 4.4% and 40 basis points as a percent of sales over 2013 on a comparable basis.
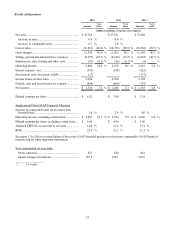
• Diluted earnings per share, excluding certain items, grew 10% to $4.40 in 2014.
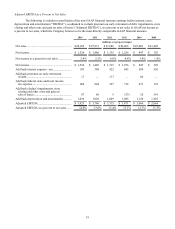
• Adjusted EBITDA (earnings before interest, taxes, depreciation and amortization, impairments, store closing and
other costs) as a percent to net sales reached 14% in 2014, the Company's long term target rate. Achieving this
target represents significant progress over the past six years since the Company adopted a unified organizational
structure, omnichannel initiatives and market localization in 2009.
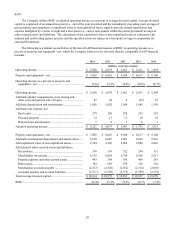
• Return on invested capital ("ROIC"), a key measure of operating productivity, reached 22.4%, 90 basis points
higher than 2013 and continued an improvement trend over the past five years.
• The Company repurchased 31.9 million shares of its common stock for $1,900 million in 2014, and increased its
annualized dividend rate to $1.25 per share. This annualized dividend rate represents an increase of 25% and is
the fourth increase in the dividend in the past three years.
See pages 17 to 20 for reconciliations of the non-GAAP financial measures presented above to the most comparable GAAP
financial measures and other important information.