Macy's 2014 Annual Report Download - page 27
Download and view the complete annual report
Please find page 27 of the 2014 Macy's annual report below. You can navigate through the pages in the report by either clicking on the pages listed below, or by using the keyword search tool below to find specific information within the annual report.-
 1
1 -
2
-
3
-
4
-
5
-
6
-
7
-
8
-
9
-
10
-
11
-
12
-
13
-
14
-
15
-
16
-
 17
17 -
 18
18 -
 19
19 -
 20
20 -
 21
21 -
 22
22 -
 23
23 -
 24
24 -
 25
25 -
 26
26 -
 27
27 -
 28
28 -
 29
29 -
 30
30 -
 31
31 -
 32
32 -
 33
33 -
 34
34 -
 35
35 -
 36
36 -
 37
37 -
38
-
39
-
40
-
41
-
42
-
43
-
44
-
45
-
46
-
47
-
48
-
49
-
50
-
51
-
52
-
53
-
54
-
55
-
56
-
57
-
58
-
59
-
60
-
61
-
62
-
63
-
64
-
65
-
66
-
67
-
68
-
69
-
70
-
71
-
72
-
73
-
74
-
75
-
76
-
77
-
78
-
79
-
80
-
81
-
82
-
83
-
84
-
85
-
86
-
87
-
88
-
89
-
90
-
91
-
92
-
93
-
94
-
95
-
96
-
97
-
98
-
99
-
100
-
101
-
102
-
103
-
104
 |
 |

22
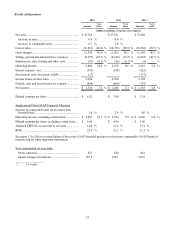
Comparison of 2014 and 2013
Net Income
Net income for 2014 increased compared to 2013, reflecting the benefits of the key strategies at Macy's and
Bloomingdale's as well as lower retirement expenses, higher income from credit operations and gains on the sale of certain
store locations and surplus properties, partially offset by greater investments in the Company's omnichannel operations and
higher depreciation and amortization expense.
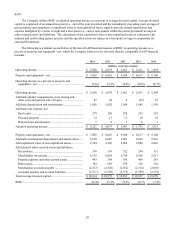
Net Sales
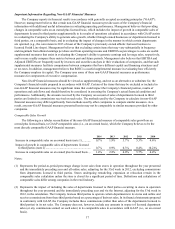
Net sales for 2014 increased $174 million or 0.6% compared to 2013. The increase in comparable sales on an owned
basis for 2014 was 0.7% compared to 2013. The increase in comparable sales on an owned plus licensed basis for 2014 was
1.4% compared to 2013. (See page 17 for information regarding the Company's calculation of comparable sales, a
reconciliation of the non-GAAP measure which takes into account sales of departments licensed to third parties to the most
comparable GAAP measure and other important information). The Company continues to benefit from the successful
execution of the My Macy's localization, Omnichannel and Magic Selling strategies. Geographically, sales in 2014 were
strongest in the southern regions. By family of business, sales in 2014 were strongest in handbags, active and millennial
apparel, furniture and mattresses. Sales in 2014 were less strong in the housewares and tabletop businesses. Sales of the
Company's private label brands represented approximately 20% of net sales in the Macy's-branded operations in 2014.
Cost of Sales
Cost of sales for 2014 increased $138 million from 2013. The cost of sales rate as a percent to net sales of 60.0% was
10 basis points higher in 2014, as compared to 59.9% in 2013, primarily due to continued growth of the omnichannel
businesses and the resulting impact of free shipping. The application of the last-in, first-out (LIFO) retail inventory method
did not result in the recognition of any LIFO charges or credits affecting cost of sales in either period.
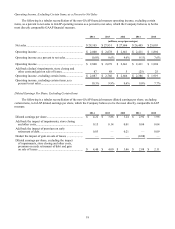
Selling, General and Administrative Expenses
Selling, general and administrative (“SG&A”) expenses for 2014 decreased $85 million from 2013. The SG&A rate
as a percent to net sales of 29.7% was 50 basis points lower in 2014, as compared to 2013. SG&A expenses in 2014
benefited from lower retirement expenses (including Pension Plan, SERP and 401(k) expenses), higher income from credit
operations, and gains on the sale of certain store locations and surplus properties, partially offset by greater investments in
the Company's omnichannel operations and higher depreciation and amortization expense. Retirement expenses were $63
million in 2014 as compared to $235 million in 2013, reflecting the transition to defined contribution plans from defined
benefit plans. Income from credit operations was $776 million in 2014 as compared to $731 million in 2013. 2014 and
2013 included gains on the sales of office buildings and surplus properties of $92 million and $79 million, respectively.
Depreciation and amortization expense was $1,036 million for 2014, compared to $1,020 million for 2013. Advertising
expense, net of cooperative advertising allowances, was $1,177 million for 2014 compared to $1,166 million for 2013.
Advertising expense, net of cooperative advertising allowances, as a percent to net sales was 4.2% for both 2014 and 2013.
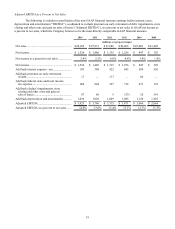
Impairments, Store Closing and Other Costs
Impairments, store closing and other costs for 2014 includes costs and expenses primarily associated with
organization changes and store closings announced in January 2015. During 2014, these costs and expenses included $46
million of severance and other human resource-related costs and asset impairment charges of $33 million. Impairments,
store closing and other costs for 2013 included costs and expenses primarily associated with cost-reduction initiatives and
store closings announced in January 2014. During 2013, these costs and expenses included $43 million of severance and
other human resource-related costs and asset impairment charges of $39 million.
Net Interest Expense
Net interest expense for 2014 increased $5 million from 2013. The increase in net interest expense for 2014 was due
to higher levels of average outstanding borrowings as compared to 2013.