Macy's 2014 Annual Report Download - page 90
Download and view the complete annual report
Please find page 90 of the 2014 Macy's annual report below. You can navigate through the pages in the report by either clicking on the pages listed below, or by using the keyword search tool below to find specific information within the annual report.-
 1
1 -
2
-
3
-
4
-
5
-
6
-
7
-
8
-
9
-
10
-
11
-
12
-
13
-
14
-
15
-
16
-
17
-
18
-
19
-
20
-
21
-
22
-
23
-
24
-
25
-
26
-
27
-
28
-
29
-
30
-
31
-
32
-
33
-
34
-
35
-
36
-
37
-
38
-
39
-
40
-
41
-
42
-
43
-
44
-
45
-
46
-
47
-
48
-
49
-
50
-
51
-
52
-
53
-
54
-
55
-
56
-
57
-
58
-
59
-
60
-
61
-
62
-
63
-
64
-
65
-
66
-
67
-
68
-
69
-
70
-
71
-
72
-
73
-
74
-
75
-
76
-
77
-
78
-
79
-
 80
80 -
 81
81 -
 82
82 -
 83
83 -
 84
84 -
 85
85 -
 86
86 -
 87
87 -
 88
88 -
 89
89 -
 90
90 -
 91
91 -
 92
92 -
 93
93 -
 94
94 -
 95
95 -
 96
96 -
 97
97 -
 98
98 -
 99
99 -
 100
100 -
101
-
102
-
103
-
104
 |
 |

NOTES TO CONSOLIDATED FINANCIAL STATEMENTS — (Continued)
F-43
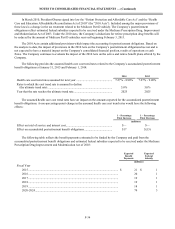
Financial instruments that potentially subject the Company to concentrations of credit risk consist principally of
temporary cash investments. The Company places its temporary cash investments in what it believes to be high credit
quality financial instruments.
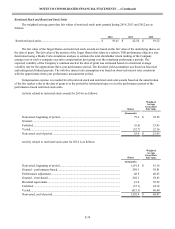
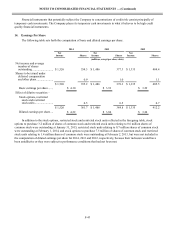
14. Earnings Per Share
The following table sets forth the computation of basic and diluted earnings per share:
2014 2013 2012
Net
Income Shares Net
Income Shares Net
Income Shares
(millions, except per share data)
Net income and average
number of shares
outstanding ............................ $ 1,526 354.3 $ 1,486 377.3 $ 1,335 404.4
Shares to be issued under
deferred compensation
and other plans....................... 0.9 1.0 1.1
$ 1,526 355.2 $ 1,486 378.3 $ 1,335 405.5
Basic earnings per share....... $ 4.30 $ 3.93 $ 3.29
Effect of dilutive securities –
Stock options, restricted
stock and restricted
stock units......................... 6.5 6.5 6.7
$ 1,526 361.7 $ 1,486 384.8 $ 1,335 412.2
Diluted earnings per share.... $ 4.22 $ 3.86 $ 3.24
In addition to the stock options, restricted stock and restricted stock units reflected in the foregoing table, stock
options to purchase 3.2 million of shares of common stock and restricted stock units relating to 0.6 million shares of
common stock were outstanding at January 31, 2015, restricted stock units relating to 0.7 million shares of common stock
were outstanding at February 1, 2014, and stock options to purchase 7.5 million of shares of common stock and restricted
stock units relating to 1.4 million shares of common stock were outstanding at February 2, 2013, but were not included in
the computation of diluted earnings per share for 2014, 2013 and 2012, respectively, because their inclusion would have
been antidilutive or they were subject to performance conditions that had not been met.