Macy's 2014 Annual Report Download - page 23
Download and view the complete annual report
Please find page 23 of the 2014 Macy's annual report below. You can navigate through the pages in the report by either clicking on the pages listed below, or by using the keyword search tool below to find specific information within the annual report.-
 1
1 -
2
-
3
-
4
-
5
-
6
-
7
-
8
-
9
-
10
-
11
-
12
-
 13
13 -
 14
14 -
 15
15 -
 16
16 -
 17
17 -
 18
18 -
 19
19 -
 20
20 -
 21
21 -
 22
22 -
 23
23 -
 24
24 -
 25
25 -
 26
26 -
 27
27 -
 28
28 -
 29
29 -
 30
30 -
 31
31 -
 32
32 -
 33
33 -
34
-
35
-
36
-
37
-
38
-
39
-
40
-
41
-
42
-
43
-
44
-
45
-
46
-
47
-
48
-
49
-
50
-
51
-
52
-
53
-
54
-
55
-
56
-
57
-
58
-
59
-
60
-
61
-
62
-
63
-
64
-
65
-
66
-
67
-
68
-
69
-
70
-
71
-
72
-
73
-
74
-
75
-
76
-
77
-
78
-
79
-
80
-
81
-
82
-
83
-
84
-
85
-
86
-
87
-
88
-
89
-
90
-
91
-
92
-
93
-
94
-
95
-
96
-
97
-
98
-
99
-
100
-
101
-
102
-
103
-
104
 |
 |

18
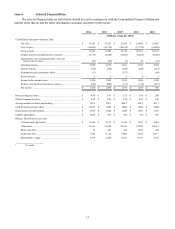
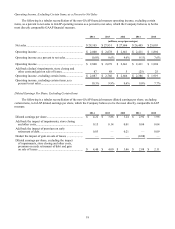
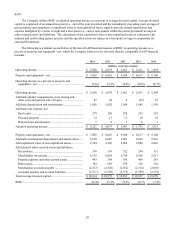
Operating Income, Excluding Certain Items, as a Percent to Net Sales
The following is a tabular reconciliation of the non-GAAP financial measure operating income, excluding certain
items, as a percent to net sales to GAAP operating income as a percent to net sales, which the Company believes to be the
most directly comparable GAAP financial measure.
2014 2013 2012 2011 2010
(millions, except percentages)
Net sales............................................................................. $ 28,105 $ 27,931 $ 27,686 $ 26,405 $ 25,003
Operating income .............................................................. $ 2,800 $ 2,678 $ 2,661 $ 2,411 $ 1,894
Operating income as a percent to net sales........................ 10.0% 9.6% 9.6% 9.1% 7.6%
Operating income .............................................................. $ 2,800 $ 2,678 $ 2,661 $ 2,411 $ 1,894
Add back (deduct) impairments, store closing and
other costs and gain on sale of leases............................. 87 88 5 (25) 25
Operating income, excluding certain items....................... $ 2,887 $ 2,766 $ 2,666 $ 2,386 $ 1,919
Operating income, excluding certain items, as a
percent to net sales......................................................... 10.3% 9.9% 9.6% 9.0% 7.7%
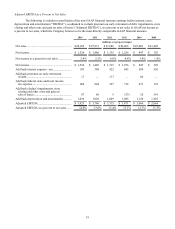
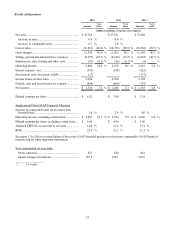
Diluted Earnings Per Share, Excluding Certain Items
The following is a tabular reconciliation of the non-GAAP financial measure diluted earnings per share, excluding
certain items, to GAAP diluted earnings per share, which the Company believes to be the most directly comparable GAAP
measure.
2014 2013 2012 2011 2010
Diluted earnings per share................................................. $ 4.22 $ 3.86 $ 3.24 $ 2.92 $ 1.98
Add back the impact of impairments, store closing
and other costs................................................................ 0.15 0.14 0.01 0.04 0.04
Add back the impact of premium on early
retirement of debt........................................................... 0.03 — 0.21 — 0.09
Deduct the impact of gain on sale of leases ...................... ———(0.08) —
Diluted earnings per share, excluding the impact
of impairments, store closing and other costs,
premium on early retirement of debt and gain
on sale of leases ............................................................. $ 4.40 $ 4.00 $ 3.46 $ 2.88 $ 2.11