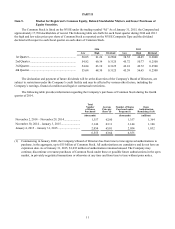
Macy's 2014 Annual Report Download - page 22
Download and view the complete annual report
Please find page 22 of the 2014 Macy's annual report below. You can navigate through the pages in the report by either clicking on the pages listed below, or by using the keyword search tool below to find specific information within the annual report.-
 1
1 -
2
-
3
-
4
-
5
-
6
-
7
-
8
-
9
-
10
-
11
-
 12
12 -
 13
13 -
 14
14 -
 15
15 -
 16
16 -
 17
17 -
 18
18 -
 19
19 -
 20
20 -
 21
21 -
 22
22 -
 23
23 -
 24
24 -
 25
25 -
 26
26 -
 27
27 -
 28
28 -
 29
29 -
 30
30 -
 31
31 -
 32
32 -
33
-
34
-
35
-
36
-
37
-
38
-
39
-
40
-
41
-
42
-
43
-
44
-
45
-
46
-
47
-
48
-
49
-
50
-
51
-
52
-
53
-
54
-
55
-
56
-
57
-
58
-
59
-
60
-
61
-
62
-
63
-
64
-
65
-
66
-
67
-
68
-
69
-
70
-
71
-
72
-
73
-
74
-
75
-
76
-
77
-
78
-
79
-
80
-
81
-
82
-
83
-
84
-
85
-
86
-
87
-
88
-
89
-
90
-
91
-
92
-
93
-
94
-
95
-
96
-
97
-
98
-
99
-
100
-
101
-
102
-
103
-
104
 |
 |

17
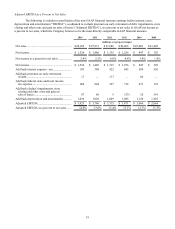
Important Information Regarding Non-GAAP Financial Measures
The Company reports its financial results in accordance with generally accepted accounting principles ("GAAP").
However, management believes that certain non-GAAP financial measures provide users of the Company's financial
information with additional useful information in evaluating operating performance. Management believes that providing
changes in comparable sales on an owned plus licensed basis, which includes the impact of growth in comparable sales of
departments licensed to third parties supplementally to its results of operations calculated in accordance with GAAP assists
in evaluating the Company's ability to generate sales growth, whether through owned businesses or departments licensed to
third parties, on a comparable basis, and in evaluating the impact of changes in the manner in which certain departments
are operated (e.g., the conversion in 2013 of most of the Company's previously owned athletic footwear business to
licensed Finish Line shops). Management believes that excluding certain items that may vary substantially in frequency
and magnitude from diluted earnings per share and from operating income and EBITDA as percentages to sales are useful
supplemental measures that assist in evaluating the Company's ability to generate earnings and leverage sales, respectively,
and to more readily compare these metrics between past and future periods. Management also believes that EBITDA and
Adjusted EBITDA are frequently used by investors and securities analysts in their evaluations of companies, and that such
supplemental measures facilitate comparisons between companies that have different capital and financing structures and/
or tax rates. In addition, management believes that ROIC is a useful supplemental measure in evaluating how efficiently
the Company employs its capital. The Company uses some of these non-GAAP financial measures as performance
measures for components of executive compensation.
Non-GAAP financial measures should be viewed as supplementing, and not as an alternative or substitute for, the
Company's financial results prepared in accordance with GAAP. Certain of the items that may be excluded or included in
non-GAAP financial measures may be significant items that could impact the Company's financial position, results of
operations and cash flows and should therefore be considered in assessing the Company's actual financial condition and
performance. Additionally, the amounts received by the Company on account of sales of departments licensed to third
parties are limited to commissions received on such sales. The methods used by the Company to calculate its non-GAAP
financial measures may differ significantly from methods used by other companies to compute similar measures. As a
result, any non-GAAP financial measures presented herein may not be comparable to similar measures provided by other
companies.
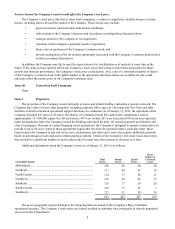
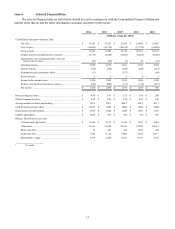
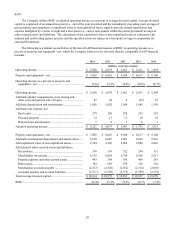
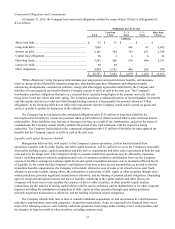
Comparable Sales Growth
The following is a tabular reconciliation of the non-GAAP financial measure of comparable sales growth on an
owned plus licensed basis, to GAAP comparable sales (i.e., on an owned basis), which the Company believes to be the
most directly comparable GAAP financial measure.
2014 2013 2012 2011 2010
Increase in comparable sales on an owned basis (note 1)............ 0.7% 1.9% 3.7% 5.3% 4.6%
Impact of growth in comparable sales of departments licensed
to third parties (note 2)............................................................. 0.7% 0.9% 0.3% 0.4% (0.2)%
Increase in comparable sales on an owned plus licensed basis ... 1.4% 2.8% 4.0% 5.7% 4.4%
Notes:
(1) Represents the period-to-period percentage change in net sales from stores in operation throughout the year presented
and the immediately preceding year and all online sales, adjusting for the 53rd week in 2012, excluding commissions
from departments licensed to third parties. Stores undergoing remodeling, expansion or relocation remain in the
comparable sales calculation unless the store is closed for a significant period of time. Definitions and calculations of
comparable sales differ among companies in the retail industry.
(2) Represents the impact of including the sales of departments licensed to third parties occurring in stores in operation
throughout the year presented and the immediately preceding year and via the Internet, adjusting for the 53rd week in
2012, in the calculation. The Company licenses third parties to operate certain departments in its stores and online and
receives commissions from these third parties based on a percentage of their net sales. In its financial statements prepared
in conformity with GAAP, the Company includes these commissions (rather than sales of the departments licensed to
third parties) in its net sales. The Company does not, however, include any amounts in respect of licensed department
sales (or any commissions earned on such sales) in its comparable sales in accordance with GAAP (i.e., on an owned
basis).